3.3.4 - Products, portfolios and life cycles
Product decisions concern what a business offers and how it allocates resources across those offers. This lesson examines customer benefits, the Boston Matrix, product life cycles and the conditions that make new product development worthwhile.
Product benefits in different markets
A product is the bundle of benefits a customer obtains, including a good or service and the support surrounding it.
A physical good such as a drill offers features, performance and durability, but customers may also value instructions, repair support, packaging and a warranty. A service such as machine maintenance offers an outcome and experience: competence, timeliness and reassurance matter even though there is no finished object to store. Product decisions include design, quality, range, features and supporting services. More features are valuable only if customers use or appreciate them enough to justify their cost.
Consumer markets involve purchases for personal use. Industrial markets involve businesses buying goods or services for their operations. A household buying a drill for occasional use may prioritise price and ease of storage. A construction business may prioritise durability, downtime, spare parts and compatibility because a failed drill interrupts paid work. Both buy a good, but the purchasing criteria differ.
The same distinction applies to services. A household cleaning service may compete on convenience and trust in the home; a factory-cleaning contract may require specialised training, documented procedures and reliable scheduling around production. Industrial buying can involve several decision makers and negotiated contracts. It is misleading to assume that services are only consumer products or that industrial purchasers care only about a low price.
Product choices affect other functions. An added feature may increase material costs, production complexity and training needs. An easy-to-repair design can support reliability and reduce waste, but may require more expensive components. A wide range can attract more segments yet increase inventory and make forecasting harder. The useful question is how the chosen product solves the target customer's problem within the firm's resources and objectives.
Product portfolios and the Boston Matrix
Portfolio analysis considers the collection of products together so that investment in one can be assessed alongside the cash and risks of others.
The Boston Matrix classifies products by market growth and relative market share. Market growth concerns the whole market, rather than the product's own sales growth. Relative market share compares the product's share with its largest competitor's share; a ratio above one means the product leads that competitor. A business's high absolute share can still be a low relative share if a rival is larger.
| Category | Relative share | Market growth | Typical resource implication |
|---|---|---|---|
| Star | High | High | Strong position but continuing investment may be needed to sustain growth |
| Cash cow | High | Low | Established position may generate cash beyond reinvestment needs |
| Question mark | Low | High | Investment may build share, but success is uncertain |
| Dog | Low | Low | Limited growth prospects; investigate whether to retain, harvest or withdraw |
These are typical model predictions, not financial measurements. A star may consume substantial cash because capacity and distribution must expand. A cash cow can help finance selected question marks. Investment in every question mark would spread resources too thinly; managers must assess which ones have a credible route to competitiveness. A dog might still produce positive cash, support another product or serve an important customer.
[DIAGRAM: asset_name: Boston Matrix portfolio positions; asset_slug: aqa_b15_boston; caption: Relative market share and market growth classify four products, but the categories alone do not measure profit or cash.; description: This Boston Matrix places high relative market share to the left and low to the right, with a boundary ratio of 1. Market growth is high above a supplied 10% threshold and low below. Products are plotted at relative shares 2, 0.5, 2 and 0.5 with growth 16%, 16%, 4% and 4%, identifying star, question mark, cash cow and dog respectively.]
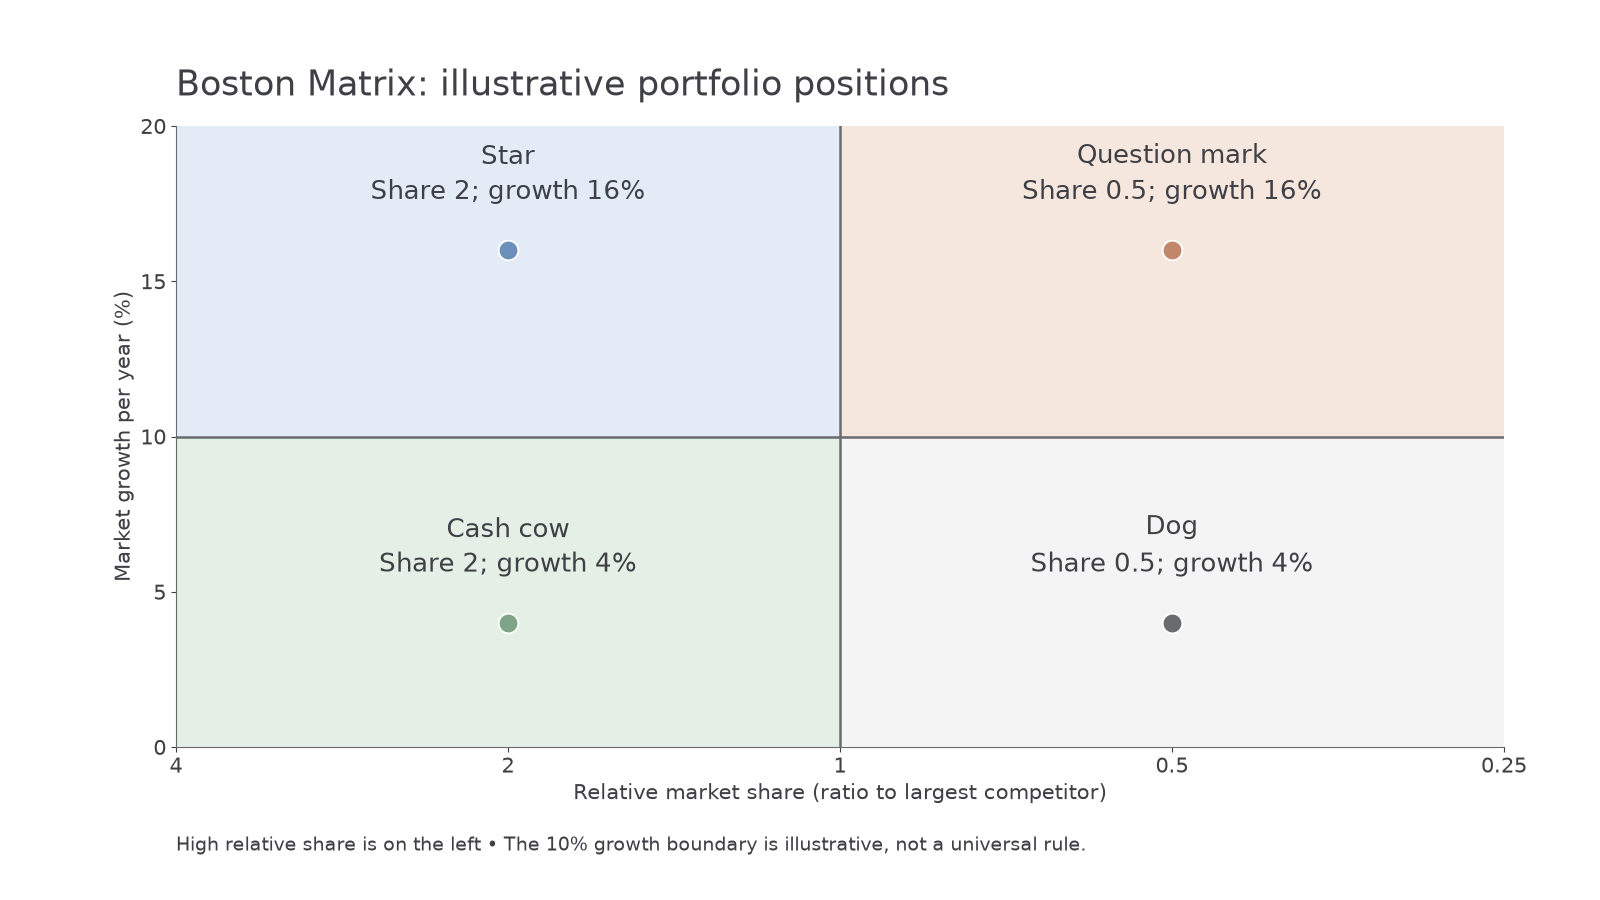
Illustrative case: a toolmaker's portfolio contains a high-share standard drill in a slow-growing market and a low-share battery inspection device in a fast-growing market. The matrix suggests using available cash from the drill to investigate investment in the new device. It does not establish that the new device will win share. Customer evidence, development cost, rival patents and the firm's skills could overturn the apparent recommendation.
Calculating relative share before classification
Product J holds 40% of a market, while its largest rival holds 50%; market growth is 16%.
- Compare its share with the largest rival:
- The ratio is below 1, so relative share is low despite an absolute share of 40%.
- With high market growth, J is a question mark under the supplied classification.
Product K holds 30% while its largest rival holds 20%, in a market growing 4%.
- Calculate the ratio:
- A ratio above 1 indicates leadership relative to the largest competitor.
- With low market growth, K is a cash cow under these classifications. Actual cash generation must still be checked.
The model simplifies complex markets. Defining the market narrowly can inflate apparent relative share; growth rates and classification thresholds can change. High share does not guarantee low cost or strong cash generation, and a fast-growing market can be intensely competitive. Portfolio interdependencies are easy to miss: withdrawing a low-share accessory might reduce demand for a profitable main product. Use actual cash, profitability and strategic evidence alongside the matrix rather than mechanically following category labels.
Product life cycles and extension strategies
The product life cycle is a model of how a product's sales may change over time, helping managers anticipate different marketing and resource needs.
During development, research and design create costs before sales begin. At introduction, sales may be low because customers do not yet know the product and distribution is limited. Growth involves rising sales as adoption and availability expand. In maturity, growth slows and sales may stabilise as the market becomes established; competition and replacement purchasing become important. During decline, sales fall as preferences, substitutes or technology change. Some presentations distinguish a saturation period near the sales peak; the underlying issue is that sustained rapid growth has ended.
The diagram shows the general life-cycle model; it does not forecast a named product's sales. Sales revenue and profit have different patterns. Development can generate losses, but the timing of later profits depends on prices, costs and investment. A high sales curve alone cannot establish a high profit figure.
[DIAGRAM: asset_name: Product life cycle and an extension; asset_slug: aqa_b15_life_cycle; caption: A possible extension strategy delays the decline in sales, but neither the stages nor the extension are guaranteed.; description: An unnumbered time axis shows development before first sales, introduction, growth, maturity and decline. The blue sales curve is zero in development, rises through introduction and growth, levels in maturity and falls in decline. A dashed sage extension path begins during maturity and maintains sales for longer. The vertical axis is sales volume rather than profit.]
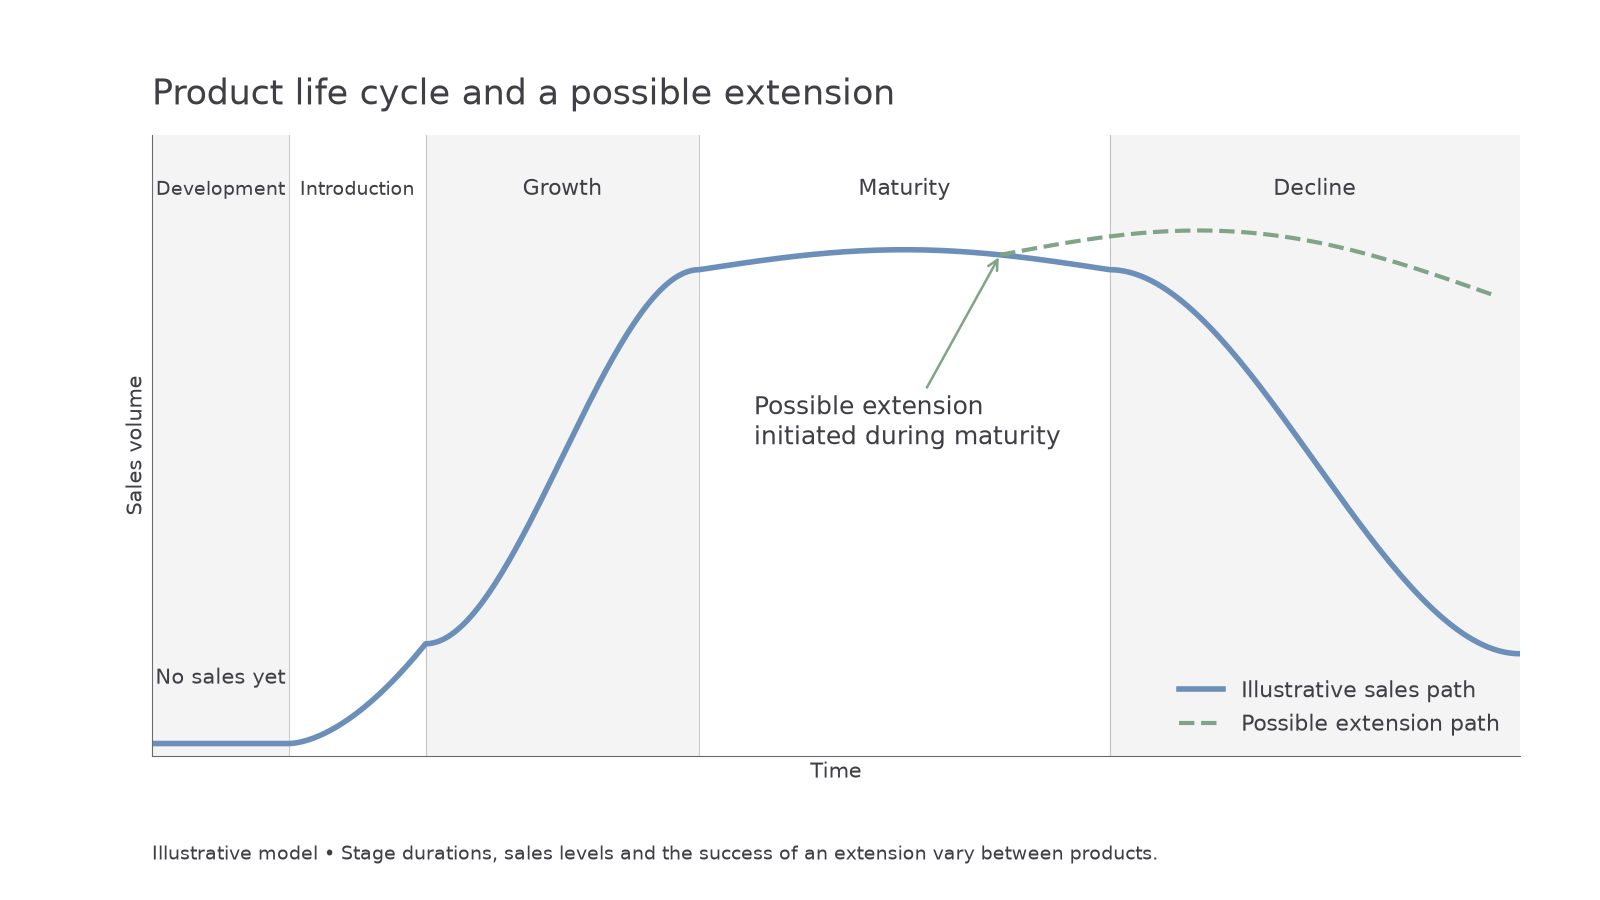
An extension strategy seeks to prolong sales before or during decline. Product improvements may restore customer interest, such as adding repairability or useful new features. Repositioning or promotion may reach a different customer group. New geographical markets may provide buyers who have not previously adopted the product. A price adjustment can stimulate purchases, but repeated discounting may weaken a premium position and sacrifice margin.
Illustrative case: a mature home-organising application adds shared household planning. This could encourage existing users to continue and attract families, but development and support costs must be compared with expected extra subscriptions. A cosmetic redesign that customers do not value might merely postpone the recognition that the product needs replacing. Extending a declining product can also divert funds from a stronger new opportunity.
The model's main limitation is that the current stage and its duration are uncertain. A temporary fall in sales may reflect a stock shortage rather than permanent decline. Some products remain mature for decades; fashions can rise and fall quickly; a repositioned product may grow again. Rival action and business decisions themselves alter the curve. Managers can use the model to ask questions about demand, price, promotion and investment, but should not assign an inevitable timetable to every product.
On 10 May 2022, Apple announced that iPod touch would remain available only while supplies lasted, explaining that portable music was now integrated across devices such as iPhone and Apple Watch. Withdrawal of a dedicated product alongside substitutes illustrates why portfolio choices and changing customer solutions matter. The announcement alone does not identify an exact historical sales curve or the profitability of each iPod generation. Apple's iPod announcement.
New product development and feasibility
New product development creates or substantially improves an offer so that the business can meet changing needs and maintain future sources of sales.
Customer research can reveal unmet needs; technology can make new solutions possible; competitor launches can put pressure on an existing range. A new product may differentiate the brand, enter an attractive segment or replace revenue from a declining product. It may also fail if customers do not value the benefit enough to pay, or if the product cannot be supplied reliably.
Illustrative case: an industrial sensor manufacturer considers a wireless version for small factories. Research suggests that easier installation could appeal to customers without specialist engineers. However, the product must work reliably around industrial equipment and integrate with customers' systems. An appealing concept is insufficient if the battery life, accuracy or support service disappoints buyers.
Marketing identifies the target and tests willingness to pay; operations assesses materials, reliability and manufacturing capacity; finance checks development spending, funding and uncertain cash flows; human resources recruits or trains the engineers and support staff. These decisions interact. A lower-cost design may make the price feasible but undermine the accuracy on which the positioning depends. A launch campaign can waste money if production is delayed.
Development time, available skills, intellectual property, competitor response and ethical or environmental requirements influence the choice. A repairable product may support a sustainability objective; a complex sealed design may offer different production advantages. A business should test such trade-offs in the context of its purpose and customer needs rather than assume that innovation is always beneficial.
Limited trials and staged commitment can reveal problems before the full launch, though trials add time and may alert competitors. Managers should also consider cannibalisation: a new offer may draw sales from the firm's existing product rather than generate wholly additional demand. That can still be sensible if customers would otherwise switch to a rival. The value of development depends on the whole portfolio and the feasible long-term benefits, not the novelty of the product alone.