3.7.5 - Economic growth, inflation and policy
Economic conditions affect customers' purchasing power, business costs and investment choices. This lesson explains GDP and growth, inflation and index numbers, fiscal policy and taxation, and monetary policy, showing why the same change can create different consequences for different businesses.
GDP, growth and business demand
Gross domestic product, or GDP, measures the value of final goods and services produced within an economy over a period.
Nominal GDP uses current prices; real GDP adjusts for price changes so output volumes can be compared. Economic growth normally concerns an increase in real output. A rise in nominal GDP can partly reflect higher prices rather than more production. GDP is an economy-wide flow, not the revenue of one business or an amount of cash available to every household.
Growth can support employment, income and demand, but consequences vary. Customers may spend more on discretionary goods, while demand for some necessities changes less. A firm selling cheaper substitutes could face different conditions from a luxury supplier. GDP growth in an export market may be more relevant to an international manufacturer than growth in its home economy alone.
Consider annual real GDP index values of 100, 102 and 103.02. Growth from the first year to the second is 2%; from the second to the third it is 1%. Output still rises in the third year, although its growth rate slows. A negative growth rate would mean a fall. Do not describe slower positive growth as falling GDP.
Worked example 1 - slowing positive growth
Both changes are positive, so output rises in each period.
Worked example 2 - a contraction then recovery
An economy's real output index moves from 180 to 171 and then 179.55.
The second percentage uses 171 as its base. The later level remains 0.25% below the original 180. Equal percentage falls and rises do not cancel because their bases differ.
Managers can use economic forecasts to plan staffing, inventory and capacity. A slowing economy might prompt more cautious investment, but competitive opportunities or a particular market's growth can justify expansion. National averages hide regional, income and sector differences; forecasts can be revised. Analyse the business's actual customer exposure and flexibility rather than infer its sales directly from one GDP headline.
Inflation, index numbers and real values
Inflation is a sustained rise in the general price level, so a money increase does not always represent greater purchasing power or output.
A price index sets a base period, normally 100, and expresses later prices relative to it. An index of 120 means the measured price level is 20% above the base. If it rises to 126, the increase is six index points but . Use the previous index as the denominator for the change between those two periods.
Suppose revenue from a product rises from £100,000 to £110,000 as its relevant price index rises from 100 to 110; later revenue at base prices is . The nominal increase can be explained entirely by prices, assuming the index matches the product and period. A general consumer-price index may not match a firm's particular selling prices or input costs precisely.
Worked example 1 - index change and constant-price revenue
Worked example 2 - growth exceeds the price rise
Base-year revenue is £240,000. Later revenue is £315,000 and the relevant price index is 125, with the base year equal to 100.
The 31.25% nominal rise includes both a 25% price increase and a 5% real increase. Adding or subtracting those rates gives an approximation, not the exact combined result.
Positive inflation slowing from 8% to 3% means prices continue rising more slowly, called disinflation. Deflation means a falling general price level. The rate fell by five percentage points; that is distinct from a 5% relative reduction in the rate.
[DIAGRAM: asset_name: Rising price index with slowing inflation; asset_slug: price-index-inflation-rate; caption: Prices continue rising when inflation falls from 8% to 3%; description: Two panels compare a price index with the annual percentage changes calculated from it. The price index is 100 in Year 1, 108 in Year 2 and 111.24 in Year 3. Annual inflation is 8 percent in Year 2 and 3 percent in Year 3. The index rises in both years although its rate of increase slows.]
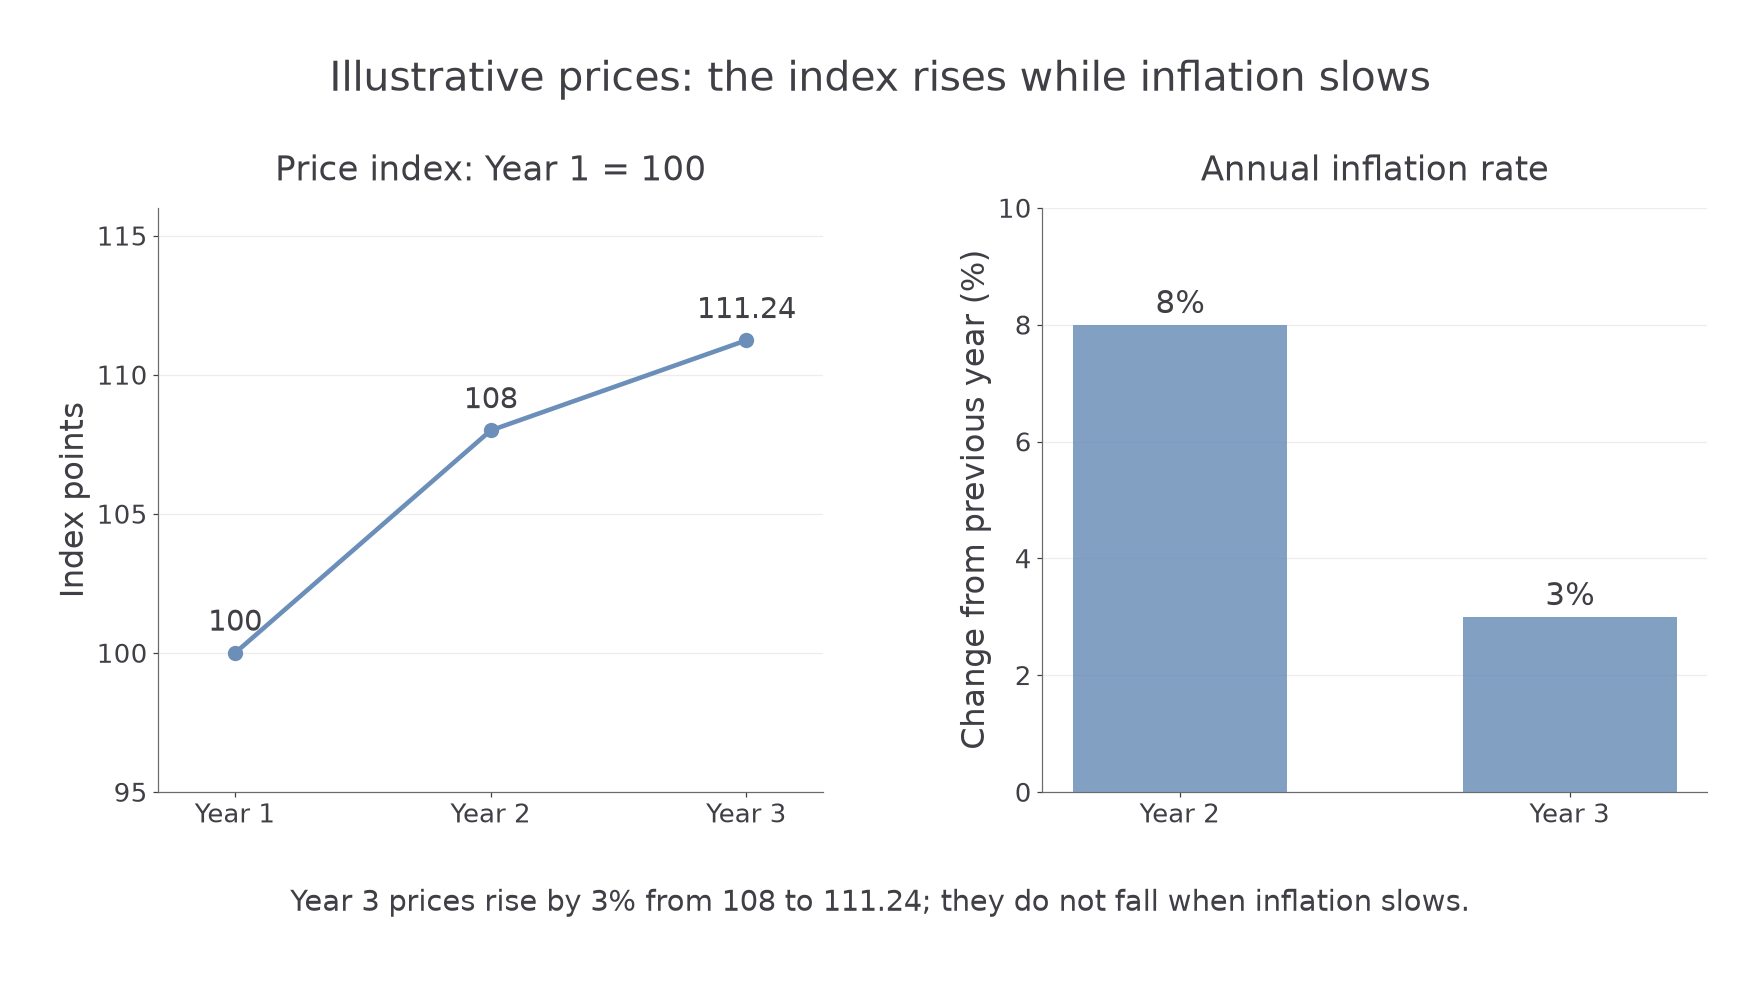
The chart's Year 3 price index is . The rate is lower, but the level is higher. Read each axis's units before drawing a conclusion.
Rising input prices can squeeze margins unless firms raise selling prices, improve efficiency or change inputs. Employees may seek higher pay to maintain purchasing power, while customers with unchanged incomes can buy less. Inflation can make forecasts and contracts harder to manage. Effects depend on pricing power, the particular costs affected and whether competitors face similar changes; higher revenue does not prove higher real sales or profit.
Continue this lesson.
You’re previewing NovaLearn without an account. Create a free account to read the rest.
Create free account