3.5.2 - Contribution and break-even analysis
Break-even analysis connects selling price, output and costs to the point at which a business covers its costs. This lesson develops contribution, break-even output and the margin of safety, then uses charts and changed assumptions to assess the value and limits of the method.
Contribution towards fixed costs and profit
Contribution is the amount remaining from sales revenue after variable costs have been deducted.
Contribution
From one sale to monthly contribution
A bag maker sells 600 bags per month at £30 each. Variable cost is £18 per bag and monthly fixed costs are £6,000.
- Contribution per bag:
- Total contribution:
- Profit after fixed costs:
Contribution from a repair service
A shoe repairer charges £24 per job, uses £7 of variable inputs per job and completes 450 jobs. Monthly fixed costs are £5,200.
- Contribution per job:
- Total contribution:
- Monthly profit:
The £17 is available towards fixed costs and then profit, rather than profit on every job.
Contribution is not profit per unit: fixed costs still have to be covered. The first £6,000 of total contribution pays the fixed costs in this model; only the contribution above that amount produces a profit. Equivalently, revenue is £18,000 and total cost is , leaving the same £1,200 profit.
These calculations assume a constant selling price and variable cost per unit, and that the units produced are sold. If different products have different contributions, do not multiply all sales by one product's contribution unless the mix is explicitly specified. A bulk order might have a lower price, and overtime might raise the variable cost per unit. The relevant contribution would then change.
Break-even output and charts
Break-even occurs where total revenue equals total cost, so the business makes neither a profit nor a loss under the model's assumptions.
Break-even output
Exact break-even output
- For the bag maker, calculate contribution:
- Divide fixed costs by that contribution:
- Check equality at that output:
Whole units and rounding
A badge printer has fixed costs £2,010, selling price £11 and variable cost £7 per badge.
- Contribution is .
- Divide fixed costs by contribution:
- Selling whole badges requires 503 to cover all costs. At 502, total contribution is £2,008, leaving a £2 loss; at 503 it is £2,012, leaving a £2 profit. Round upwards only when the output must be whole units.
If contribution is zero or negative while fixed costs are positive, increasing output cannot achieve break-even under the unchanged model.
A break-even chart places output on the horizontal axis and pounds for the same period on the vertical axis. The fixed-cost line is horizontal at £6,000. Total cost starts at £6,000 at zero output and rises by £18 for every additional bag. Revenue starts at zero and rises by £30 per bag. The intersection of revenue and total cost is at 500 bags and £15,000.
[DIAGRAM: asset_name: Bag maker break-even chart; asset_slug: 7132_b25_break_even; caption: Revenue and total cost meet at 500 bags and £15,000; sales below this output make a loss under the stated assumptions.; description: Monthly chart from zero to 800 bags. Revenue is £30 times output, total cost is £6,000 plus £18 times output, and fixed costs are £6,000. The intersection at 500 bags and £15,000 is marked.]
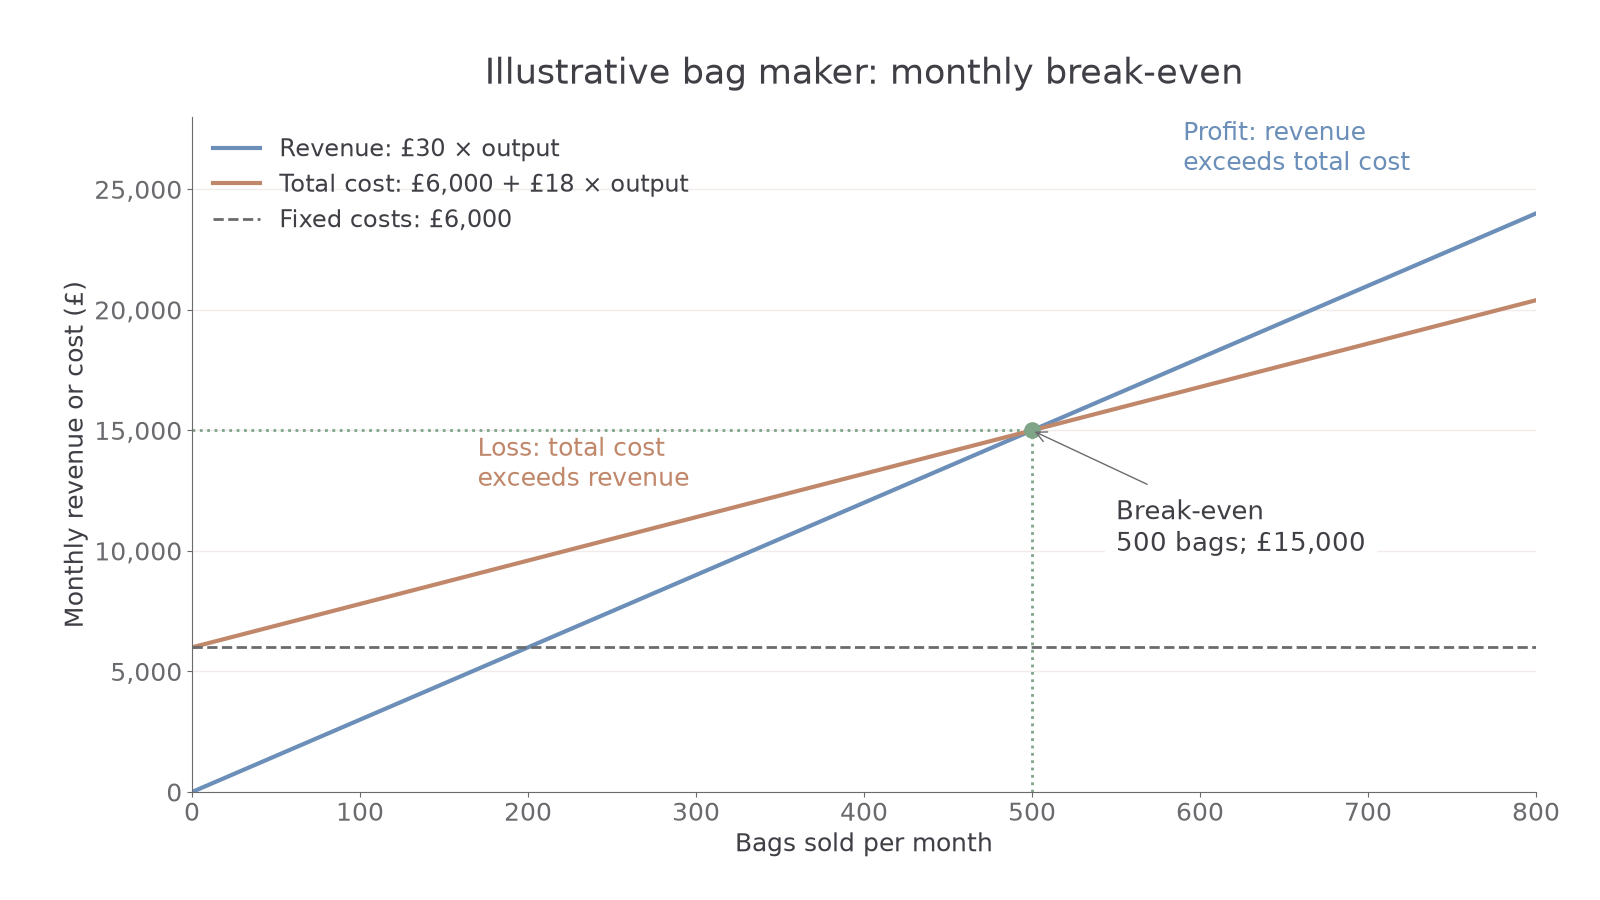
At 400 bags revenue is £12,000 and total cost £13,200: a £1,200 loss. At 600 bags revenue is £18,000 and total cost £16,800: a £1,200 profit. The vertical gap measures profit or loss in pounds. The horizontal output at the intersection is the break-even quantity.
To construct a chart, select a readable scale and plot at least two calculated points for each straight line. Label each line, both axes and the time period. Read a graphical intersection as an approximation if the scale is coarse; the formula gives the exact result within the linear model.
Margin of safety and demand risk
The margin of safety is the amount by which actual or forecast sales exceed break-even output.
Continue this lesson.
You’re previewing NovaLearn without an account. Create a free account to read the rest.
Create free account