3.2.2 - Decision trees and expected value
Decision trees organise choices whose outcomes depend on uncertain events. This lesson shows how to read their branches, calculate expected values and net gains, and use those figures alongside risk, resource constraints and non-financial considerations.
Choices, chance events and probabilities
A decision tree separates what a manager can choose from what the manager cannot control.
Decision tree
A diagram of alternative decisions and possible subsequent outcomes, with probabilities and financial values used to compare the alternatives.
A square decision node marks a choice: for example, launch a product locally or nationally. The manager selects a branch. A circular chance node marks an uncertain event, such as strong or weak demand. The branches leaving that circle represent alternative possible outcomes, not further managerial choices. Read the sequence from left to right to understand events; calculate backwards from the outcome values when comparing decisions.
A probability measures the estimated likelihood of an event. A probability of 0.6 means a 60% likelihood, not a guaranteed result. Outcomes at one chance node must cover the possibilities without double counting: if demand is either strong or weak, their probabilities sum to 1. Probabilities on alternative decision branches do not have to sum to 1 because managers choose those branches rather than experience them by chance.
A publisher must choose between two launches. A national launch costs £20,000 initially. Strong demand has probability 0.6 and would produce £80,000 of future net cash inflows; weak demand has probability 0.4 and would produce £20,000. A regional launch costs £10,000 initially, with future net cash inflows of £50,000 at probability 0.8 or £10,000 at probability 0.2. All operating costs have already been deducted from these inflows, but the initial launch cost has not. Both options cover the same period.
[DIAGRAM: asset_name: National and regional launch decision tree; asset_slug: business-launch-decision-tree; caption: Two launch choices with their initial costs and uncertain future net cash inflows; description: Decision tree in thousands of pounds. A square choice node leads to a national launch costing 20 and a regional launch costing 10. Each leads to a circular chance node. National outcomes are strong demand probability 0.6 and inflow 80, or weak demand probability 0.4 and inflow 20. Regional outcomes are strong demand probability 0.8 and inflow 50, or weak demand probability 0.2 and inflow 10. Outcome inflows exclude the initial launch cost.]
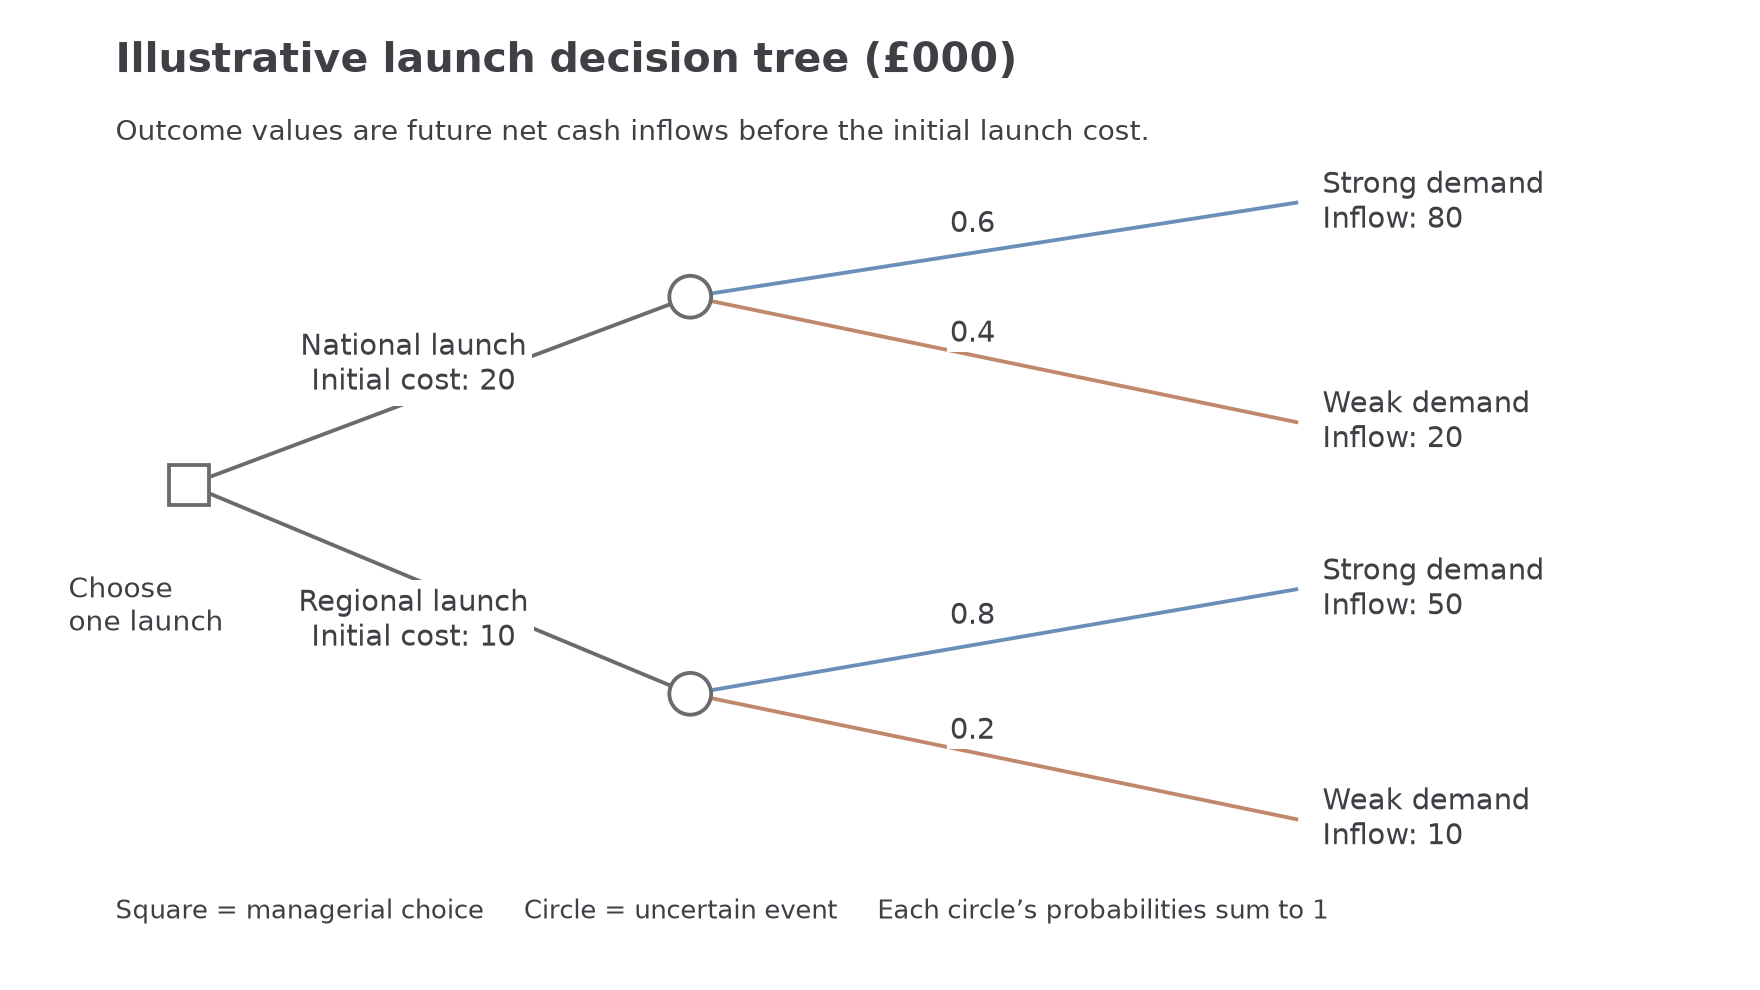
The tree makes the assumptions visible. It does not establish that the estimated probabilities or cash inflows are correct. The manager still needs evidence about demand and must check exactly which costs each outcome includes.
Expected values and net gains
An expected value combines each possible financial outcome with its estimated probability rather than simply choosing the largest outcome.
National launch
- Weight each future inflow by its probability:
- Add them to find expected future inflows:
- Deduct the initial cost once:
Regional launch
- Weight its two future inflows:
- Add the weighted inflows and deduct this option's initial cost:
- Compare like with like: national expected net gain exceeds regional expected net gain by £4,000. Both calculations use the same period and costs convention.
Outcomes already stated as net gains
A caterer faces a 0.75 chance of a £24,000 net gain and a 0.25 chance of a £12,000 net loss. Both outcomes already include the initial investment.
- Keep the loss negative:
- Add the weighted net outcomes:
- The initial investment has already been deducted in the outcomes, so subtracting it again would understate the result.
The £56,000 expected value is not one of the national launch's possible outcomes. With a single launch the stated inflow is either £80,000 or £20,000. The expected value represents a probability-weighted average across repeated comparable decisions, if the estimates hold. It is therefore a comparison tool, not a forecast that precisely £56,000 will arrive.
Subtract a cost once. If outcome values are already net of the initial investment, probability-weight those net outcomes without deducting the investment again. Equally, do not compare an option's gross expected inflows with another option's net gain. Negative values must retain their signs: an outcome representing a £5,000 loss contributes a negative amount to the weighted average.
For a tree with several successive chance stages, calculate each later chance node first and carry its expected value back to the preceding branch. At a later decision node, select the feasible option that best meets the stated criterion. This backwards approach avoids treating all branches as simultaneous outcomes.
Risk and the limits of a financial ranking
The option with the highest expected net gain is not necessarily the best decision for a particular business.
Decision trees improve a discussion by making alternatives, costs and assumptions explicit. They encourage managers to quantify uncertainty, compare decisions consistently and investigate which estimates would change the ranking. This can reveal opportunity cost: choosing the national launch means giving up the regional launch's potential benefits and committing more resources to one project.
However, the publisher's national launch has a 40% chance of a zero net gain, while the regional launch has a 20% chance of a zero net gain. The national launch also requires twice as much initial cash. A publisher with little cash or lenders unwilling to provide funding might prefer the regional launch despite its £4,000 lower expected net gain. A more financially secure publisher might accept the wider range of outcomes to pursue national reach. Consider the size and likelihood of downside outcomes, not just the average.
Risk can be represented by estimated probabilities, while uncertainty includes circumstances in which managers cannot estimate outcomes or probabilities confidently. Market research may be small, biased or outdated; a competitor could respond differently from the assumptions. Treating uncertain estimates as precise inputs can create misleading confidence. Managers should ask where the numbers came from and compare alternative assumptions. If the probability of strong national demand falls from 0.6 to 0.5, its expected net gain becomes , below the regional option's £32,000.
Non-financial factors also matter. A national launch might conflict with a mission to serve a local community, stretch staff capacity, create environmental costs or damage quality if distribution is unreliable. Conversely, it may build a valuable brand or supplier relationship beyond the period represented. A tree cannot include every such consequence reliably as a monetary value. Use its financial result to inform a judgement, together with feasibility, objectives, ethics and the quality of the underlying evidence.
Heathrow's July 2025 expansion proposal put the new runway and airfield infrastructure at £21 billion, compared with £14 billion in its 2018 estimate, attributing the increase to construction inflation. The revised estimate demonstrates how a decision's inputs can change over time. Any decision-tree comparison would need updated cost assumptions and sensitivity checks; this example does not claim Heathrow used the classroom tree above. Heathrow's 2025 proposal announcement.