3.1.1 - Revenue, costs and profit
Revenue measures sales value, costs measure the resources used and profit measures the difference between them over the same period. This lesson develops the calculations and explains why higher sales or a positive bank balance do not by themselves establish that a business has made more profit.
Measuring sales revenue
Revenue is the value of a business's sales over a stated period, before deducting costs.
The terms turnover and sales are often used to mean sales revenue in this context. Sales can also mean the number of units sold, so check whether a figure is a quantity or a money value. Selling 400 tickets is sales volume; receiving sales revenue of £3,200 is a value. Use the quantity actually sold, rather than all units produced.
Sales revenue
One selling price
A cinema sells 400 tickets at £8 for one screening, with 450 seats available.
- Select the 400 tickets sold; the 50 empty seats earn no revenue.
- Multiply quantity by selling price:
- State the period: this is revenue for one screening, before costs.
Mixed selling prices
A second screening sells 280 adult tickets at £9 and 120 child tickets at £6.
- Calculate each category's revenue:
- Add the categories:
- Check the result: all 400 tickets priced at £9 would earn £3,600, so the reduced child price correctly lowers the total.
Price and sales volume can change together. A shop sells 200 items at £10, giving revenue of £2,000. After increasing price to £12, it sells 150 items, giving £1,800. The higher price has not produced higher revenue because the reduction in units sold more than offsets it. Use both the new price and the new quantity rather than assuming a price change has a particular revenue effect.
Revenue is a flow for a period, whereas a bank balance is an amount at a point in time. A sale may be recorded before its customer pays, and receipts may include a loan rather than sales. These distinctions matter when using revenue to judge performance. A consistent comparison also uses the same period: one month's sales should not be compared directly with another year's sales.
Fixed, variable and total costs
Classifying a cost depends on how its total changes with output over the period considered.
Fixed costs do not vary with output in the short run. A workshop paying monthly rent of £1,000 incurs that cost whether it makes 0, 100 or 200 desks using the same premises. Fixed does not mean that rent never changes: a new lease or additional building can alter fixed costs later. A fixed cost can remain payable when output is zero.
Variable costs change with output. If each desk uses £30 of wood and packaging, total variable cost is £3,000 for 100 desks and £6,000 for 200. The £30 is a variable cost per unit; the totals vary even though the per-unit rate stays constant. Real per-unit rates may change with discounts, waste or overtime, so assume a constant rate only when it is stated.
Names alone are insufficient. A salary paid regardless of output may be fixed, while payment per completed desk is variable. Electricity can have a fixed standing charge and a variable usage charge. Classify the stated payment arrangement rather than memorising that all wages or all electricity have one classification.
Cost totals
The second equation assumes a constant variable cost per unit over the output range.
Monthly costs at two output levels
For the workshop, calculate materials first and then add rent:
At 200 desks the same steps give:
The extra 100 desks add £3,000, consistent with £30 per extra desk and unchanged rent.
Converting costs to a common period
A sign maker produces 240 signs in June. Materials cost £5 per sign, monthly rent is £750 and annual insurance is £1,800.
- Convert annual insurance to one month:
- Calculate June materials:
- Add all June costs:
Adding the full year's insurance would overstate June's cost.
[DIAGRAM: asset_name: Fixed and variable cost totals; asset_slug: aqa7132_b02_cost_totals; caption: Fixed cost stays at £1,000 while variable and total costs rise by £30 per desk over the stated monthly output range.; description: Cost graph with monthly desks from 0 to 200 on the horizontal axis and monthly cost in pounds from 0 to 8000 on the vertical axis. Fixed cost is a horizontal line at 1000, variable cost rises from 0 to 6000, and total cost rises from 1000 to 7000. At 100 desks variable cost is 3000 and total cost is 4000.]
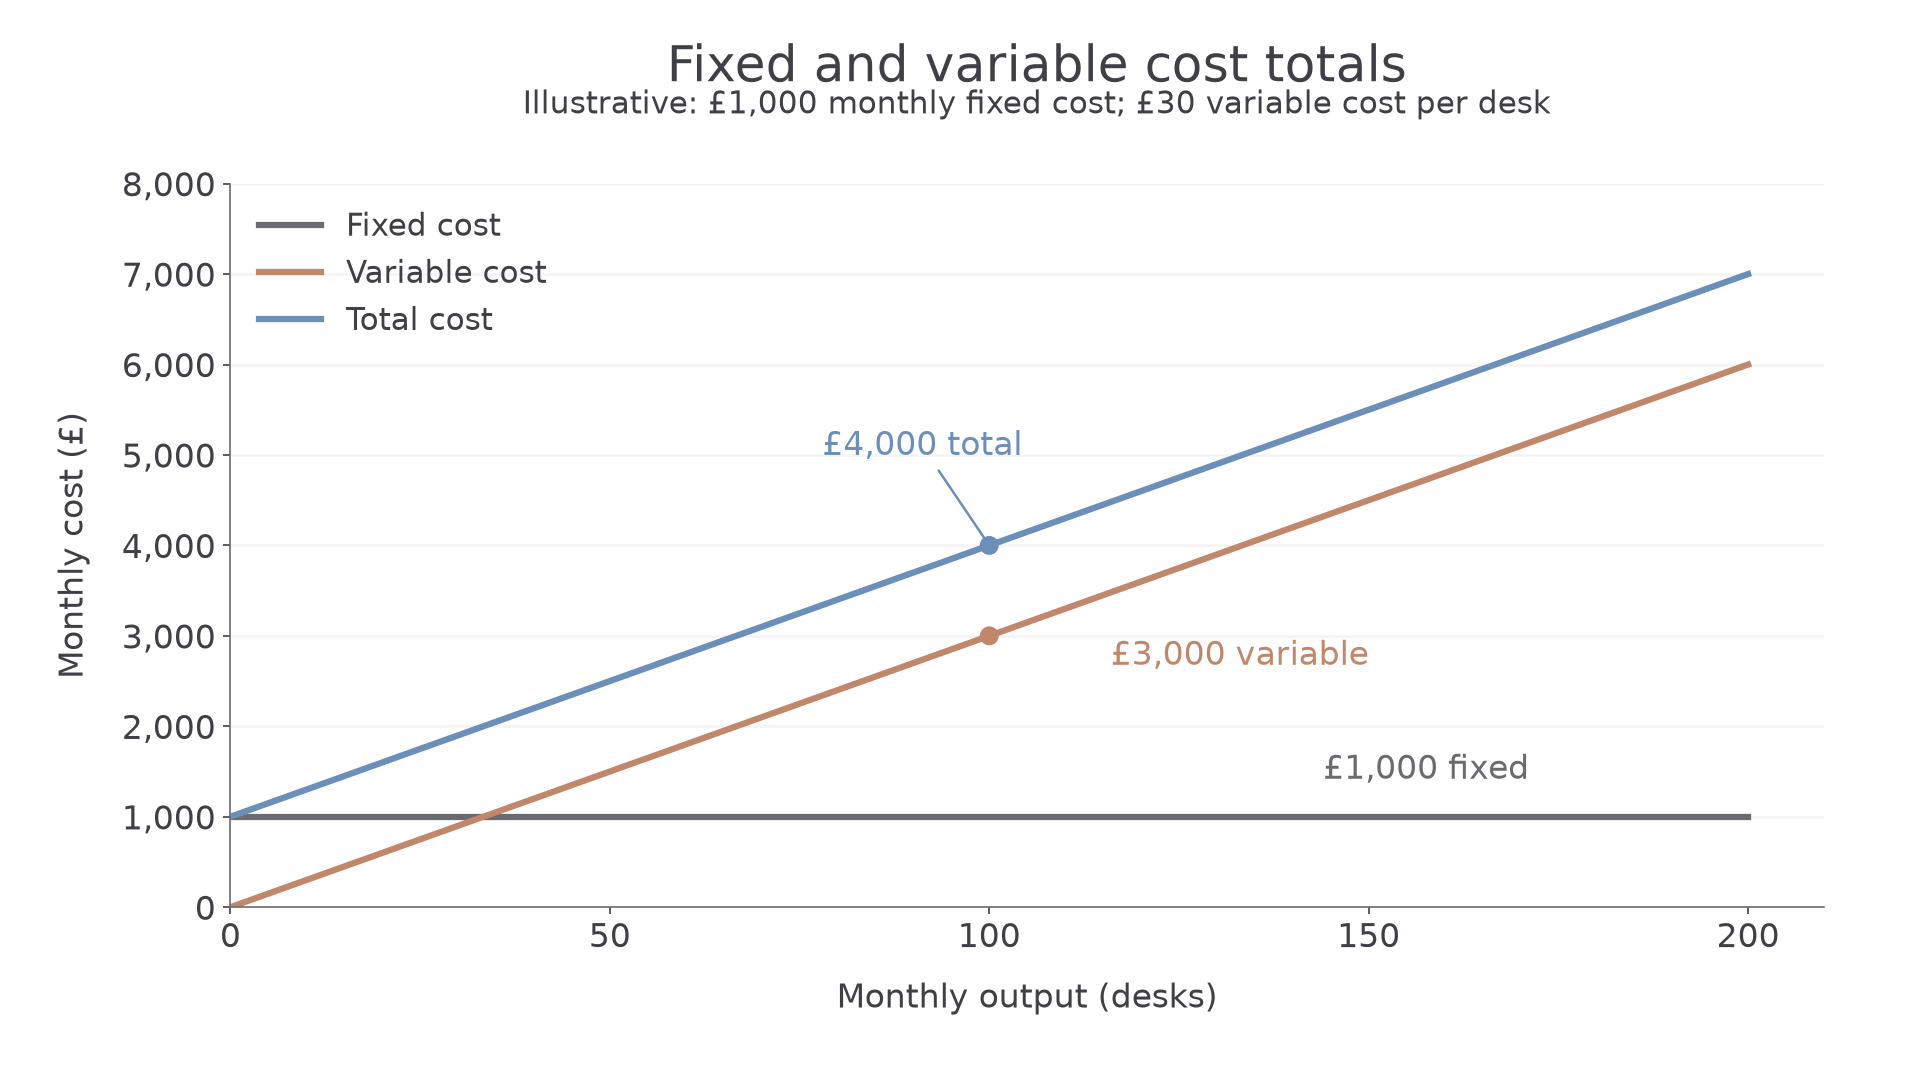
The vertical gap between total cost and variable cost is the £1,000 fixed cost. Total cost and variable cost would not stay as straight lines if the per-unit rate changed. Extending output beyond current capacity may also require additional fixed costs, so the graph applies only to its stated range.
Profit, loss and business decisions
Profit is the amount by which revenue exceeds total costs for the same period; costs exceeding revenue produce a loss.
Profit
A profitable month's output
A desk maker sells all 100 desks made in a month at £55 each. Monthly fixed cost is £1,000 and variable cost is £30 per desk.
- Calculate sales revenue:
- Include fixed and variable costs:
- Subtract cost from revenue:
Deducting materials alone would overstate profit by £1,000.
A loss despite positive sales
A laundry has weekly revenue of £2,800, fixed costs of £900 and variable costs of £2,150.
- Add costs:
- Subtract in the correct direction:
- Interpret the sign: the laundry makes a £250 weekly loss because costs exceed revenue. At equal revenue and cost, profit would be zero.
Apple's financial statements for the quarter ended 28 September 2024 reported $94.930 billion of sales and $14.736 billion of net income. The substantial difference shows why sales are not profit: cost of sales, operating expenses and taxation intervene. Apple's September 2024 financial statements.
Profit can reward owners, finance investment from retained earnings and provide a buffer against difficult trading. Sustained losses can reduce funds available to continue operating. However, a loss during an investment period does not by itself prove the whole business is unviable: managers need to investigate its cause, available finance and future prospects.
Revenue growth improves profit only if its benefit is large enough relative to the associated costs. Compare the revenue and costs in these two one-month sales plans:
| Plan | Revenue | Total costs | Profit |
|---|---|---|---|
| Existing service | £20,000 | £17,000 | £3,000 |
| Wider service | £25,000 | £23,000 | £2,000 |
The wider service raises revenue by £5,000 but raises costs by £6,000. Profit therefore falls by £1,000. Choosing the highest sales value would choose the lower-profit plan under these assumptions. Conversely, reducing waste can raise profit without increasing revenue, provided the saving exceeds any cost of introducing the improvement.
Profit is also different from cash. Customers may not have paid for recorded sales, and investment payments or borrowing can change the bank balance independently of the period's profit. A profitable business needs enough cash to meet due payments. Finally, a profit figure is an amount, not a complete comparison of profitability: the size of the business, resources used, time period and reliability of estimates also matter. Financial ratios later provide additional comparisons.
Quick Recap
Revenue is sales value, calculated using units sold and their prices. Fixed costs do not change with short-run output, variable cost totals do, and total cost includes both. Profit subtracts all relevant costs from revenue over the same period; higher revenue alone does not establish higher profit or enough cash.