4.2.1.4c - I-V Characteristics and Required Practical 4
An I-V characteristic is a graph that shows how the current through a component changes as the potential difference across it changes. The shape of the graph is evidence: it tells you whether the component behaves linearly, whether its resistance changes, and how its properties match its function. Required practical 4 uses real circuits to collect those current and potential difference readings for a resistor, a filament lamp and a diode.
What I-V graphs show
In this lesson, I means current in amperes, A, and V means potential difference in volts, V. The practical graph puts current on the vertical axis and potential difference on the horizontal axis.
I-V characteristic
An I-V characteristic is a graph of current through a component against potential difference across the component.
A straight line is a linear relationship. If the line goes through the origin, current is directly proportional to potential difference. For a resistor at constant temperature, this means the resistance remains constant as the current changes.
A curved graph is non-linear. It shows that the ratio of potential difference to current is changing, so the component's resistance is not constant. The shape of the curve is linked to what the component is made for and what happens inside it.
For an I-V graph with current on the y-axis, a shallower line or curve means less current for the same potential difference. That means a larger resistance. A steeper line means more current for the same potential difference, so a smaller resistance.
Component characteristics
The three components in required practical 4 do not give the same graph. Their graph shapes are a compact summary of their electrical behaviour.
[DIAGRAM: asset_name: I-V Characteristics and Required Practical 4 - diagram 1; asset_slug: 019_4_2_1_4c_i_v_characteristics_and_required_practical_4_diagram1; file: diagram_assets/019_4_2_1_4c_i_v_characteristics_and_required_practical_4_diagram1.png; recommended_method: deterministic_drawn; description: Exact assessed graph visual showing current on the y-axis and potential difference on the x-axis for three components: resistor at constant temperature as a straight line through the origin, filament lamp as a symmetric curve through the origin that becomes less steep at larger positive and negative potential differences, and diode as a one-direction curve with very small reverse current and a sharp forward-current rise. The visual teaches linear/non-linear classification and links curve shape to component properties, so deterministic rendering is used; nearby prose gives the accessible description.]
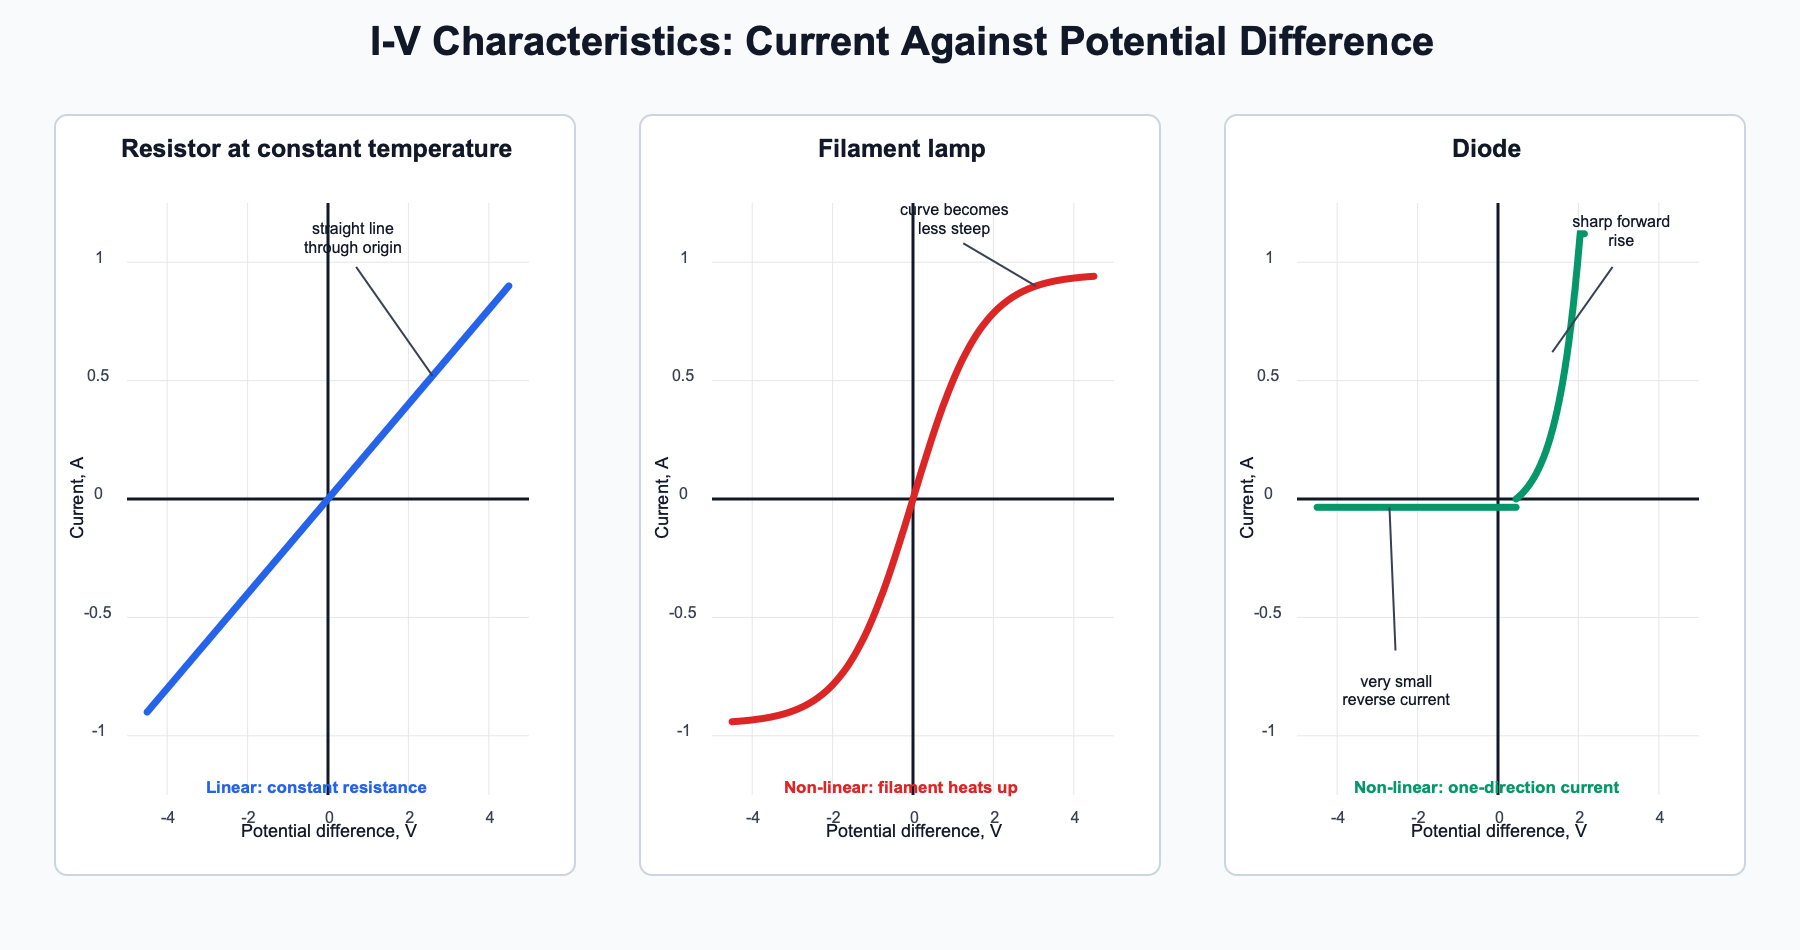
For a resistor at constant temperature, the graph is a straight line through the origin. The component is linear because doubling the potential difference doubles the current. This is the I-V characteristic of an ohmic conductor at constant temperature.
For a filament lamp, the graph curves and becomes less steep as the size of the current increases. The filament heats up, its metal ions vibrate more, and electrons collide with them more often. The resistance increases as the filament temperature increases, so the lamp is non-linear. The graph is roughly symmetric because the filament behaves similarly when the current direction is reversed.
For a diode, current flows mainly in one direction. In the reverse direction the diode has a very high resistance, so the current is very small. In the forward direction, once the diode conducts, the current increases sharply. The diode is non-linear and its graph is not symmetric because the component is directional.
The comparison matters because the same axes are used for all three components, so the shape change is real evidence rather than a change of graph style.
Required practical circuit
Required practical 4 investigates the I-V characteristics of a filament lamp, a diode and a resistor at constant temperature. The basic circuit is designed to measure two quantities at the same time: current through the component and potential difference across the component.
[DIAGRAM: asset_name: I-V Characteristics and Required Practical 4 - diagram 2; asset_slug: 019_4_2_1_4c_i_v_characteristics_and_required_practical_4_diagram2; file: diagram_assets/019_4_2_1_4c_i_v_characteristics_and_required_practical_4_diagram2.png; recommended_method: image_gen; description: Exact required-practical circuit diagram showing a low-voltage dc supply, variable resistor and ammeter in series with a replaceable test component, plus a voltmeter connected in parallel across only the test component. It includes a diode-run note: add a protective resistor in series and use a milliammeter if needed, while keeping the voltmeter across the diode. This is an assessed circuit/apparatus visual, so image-generated output must be visually checked.]
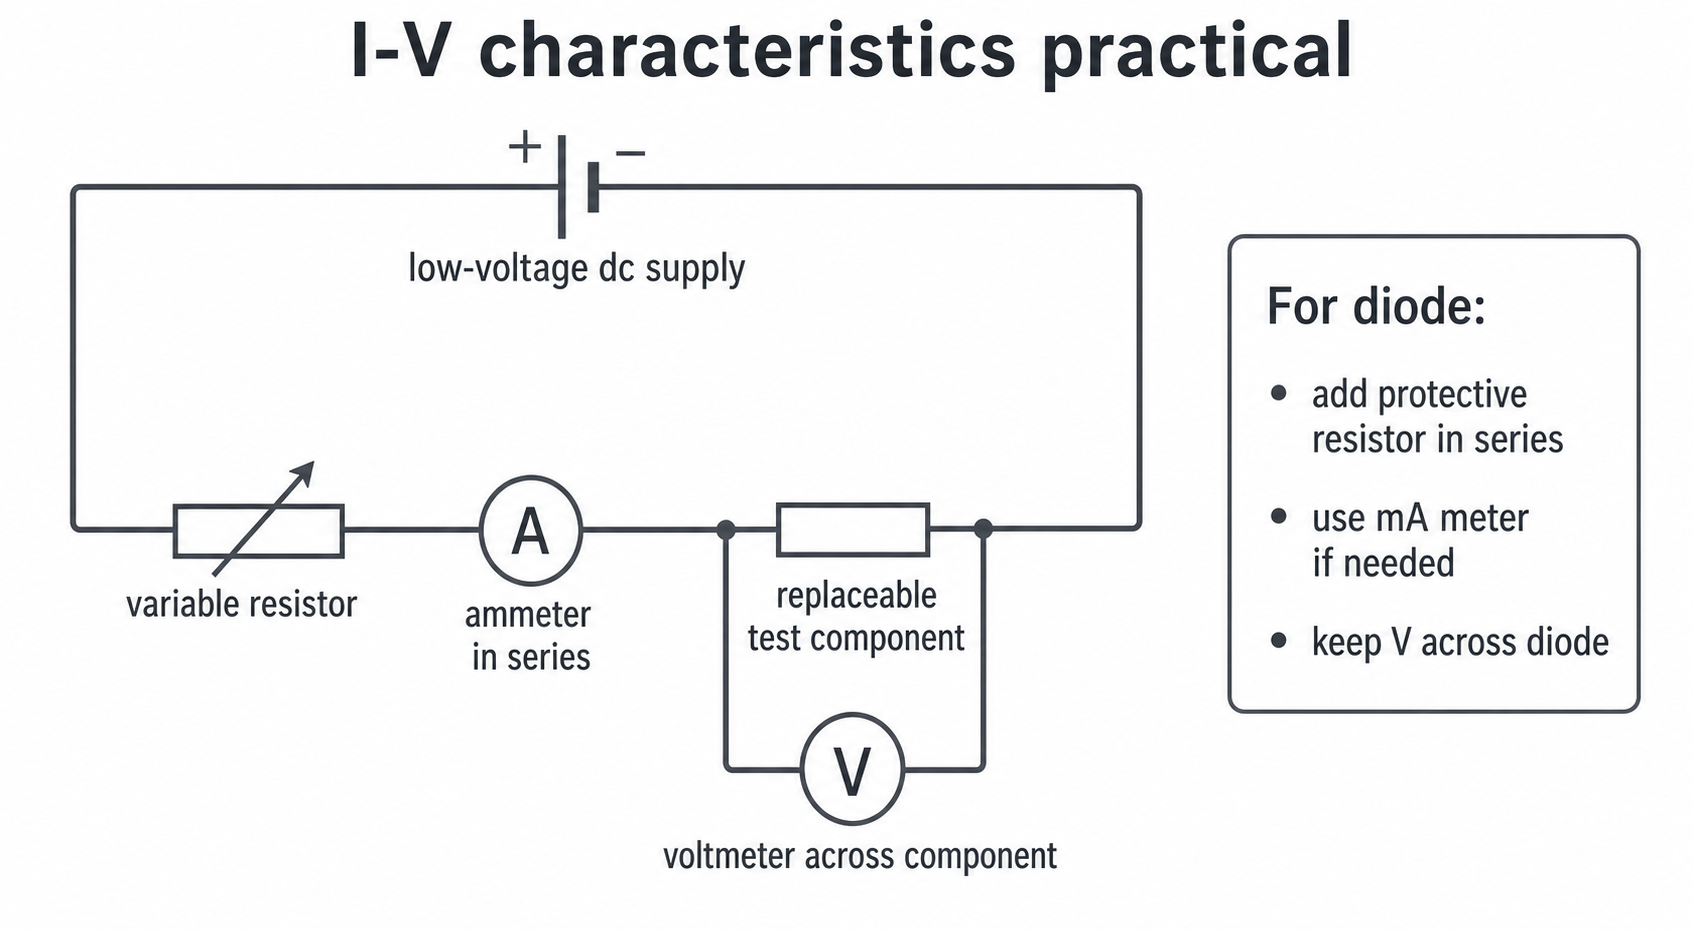
The apparatus includes:
- a low-voltage dc power supply or battery
- an ammeter in series to measure the current through the component
- a voltmeter in parallel across the component to measure the potential difference across it
- a variable resistor to change the current and potential difference
- connecting leads and a component holder
- a resistor, filament lamp and diode
- for the diode, a protective resistor in series and a milliammeter if the current is small
For each component, the independent variable is the potential difference across the component. The dependent variable is the current through the component. The temperature of the resistor should be kept as constant as possible, because heating the resistor would change its resistance and make the graph less reliable.
Method and measurements
A good method collects enough readings to show the shape of the graph without overheating the components.
- Set up the circuit with the first component in the component holder.
- Set the variable resistor so the current is small.
- Record the ammeter reading and the voltmeter reading in a results table.
- Adjust the variable resistor and record another pair of readings.
- Repeat until you have several pairs of readings over a sensible range.
- Reverse the connections to the power supply so the current and potential difference are negative.
- Repeat the readings for the negative direction.
- Replace the component and repeat the method for the other components.
A suitable results table has columns for potential difference in volts, V, and current in amperes, A. For the diode, current may be recorded in milliamperes, mA, then converted if needed before graphing.
For the resistor, keep the current low enough that the resistor does not heat much. For the lamp, expect it to get hot, so do not touch it after it has been on. For the diode, use a protective resistor in series to reduce the chance of a large current damaging the diode. Switch off or disconnect the supply between readings when possible, especially if a component is heating.
Repeat readings are useful when the same potential difference can be set again. Calculate a mean current for repeated readings at the same potential difference, but first check for anomalies. A loose connection, wrong meter range, component heating, or misread meter can produce an anomalous point.
Graphs and evaluation
Plot current on the y-axis against potential difference on the x-axis. Because negative readings are included, put the origin in the middle of the graph. Use a sensible scale that uses most of the graph paper and plot points carefully.
For a resistor at constant temperature, draw a straight line of best fit through the origin if the data support it. For a filament lamp or diode, draw a smooth curve of best fit rather than joining points dot-to-dot. The graph shape is the conclusion.
When interpreting a graph:
- straight line through the origin: linear component, constant resistance
- curve that becomes less steep as current increases: resistance increasing, as in a filament lamp
- very small reverse current and sharp forward rise: diode, high reverse resistance and one-direction current
Data quality is part of the conclusion. Comment on whether the plotted points follow the expected pattern, whether any points are anomalous, and whether the meters had suitable resolution. A digital meter reading to 0.01 A has a smaller resolution uncertainty than one reading to 0.1 A. A systematic effect, such as the resistor warming up, can shift several readings in the same direction and change the graph shape.
In this practical, the graph is not an afterthought. The line or curve is the evidence used to decide whether the component is linear or non-linear and to link its behaviour to its properties.
Evaluation answers should connect a practical problem to its effect on the graph, then suggest a specific improvement.