4.2.1.3b - Required Practical 3 - Resistance in Circuits
Resistance affects the current in a circuit for a given potential difference. In this required practical, you use circuit diagrams to build and check circuits, then use measurements of potential difference and current to calculate resistance. The investigation has two main parts: how the length of a wire affects resistance at constant temperature, and how resistor combinations in series and parallel affect total resistance.
Measuring resistance
The practical depends on a simple measurement chain: measure the potential difference across the part of the circuit being tested, measure the current through it, then calculate its resistance.
Potential difference, current and resistance
In this equation:
Vis potential difference in volts,VIis current in amperes,ARis resistance in ohms,Ω
This is a recall-and-apply equation. For the practical, it is usually rearranged to:
The ammeter must be in series with the part of the circuit being tested, because it measures the current through that part. The voltmeter must be connected in parallel across the test section, because it measures the potential difference between the two ends of that section.
Before switching on, check the circuit diagram against the real circuit:
| Check | Why it matters |
|---|---|
| Ammeter is in series | It measures the current through the test section |
| Voltmeter is across the test section | It measures the potential difference across only that section |
| Switch or flying lead is open while changing the circuit | It prevents heating and accidental short circuits |
| Meter ranges and polarity are suitable | It avoids negative or off-scale readings on many school meters |
| Leads are secure | Loose contacts can give changing readings |
Wire length method
The first activity investigates how the length of a wire affects its resistance at constant temperature. A resistance wire is fixed to a metre ruler so that the length between two crocodile clips can be changed accurately.
[DIAGRAM: asset_name: Required Practical 3 Resistance in Circuits - diagram 1; asset_slug: 016_4_2_1_3b_required_practical_3_resistance_in_circuits_diagram1; file: diagram_assets/016_4_2_1_3b_required_practical_3_resistance_in_circuits_diagram1.png; recommended_method: image_gen; description: Circuit and apparatus layout for the wire-length investigation. It shows a low-voltage supply, switch/flying lead, ammeter in series, resistance wire fixed to a metre ruler, crocodile clips A and B selecting the test length, and a voltmeter connected across clips A and B. Nearby prose supplies the method and safety details.]
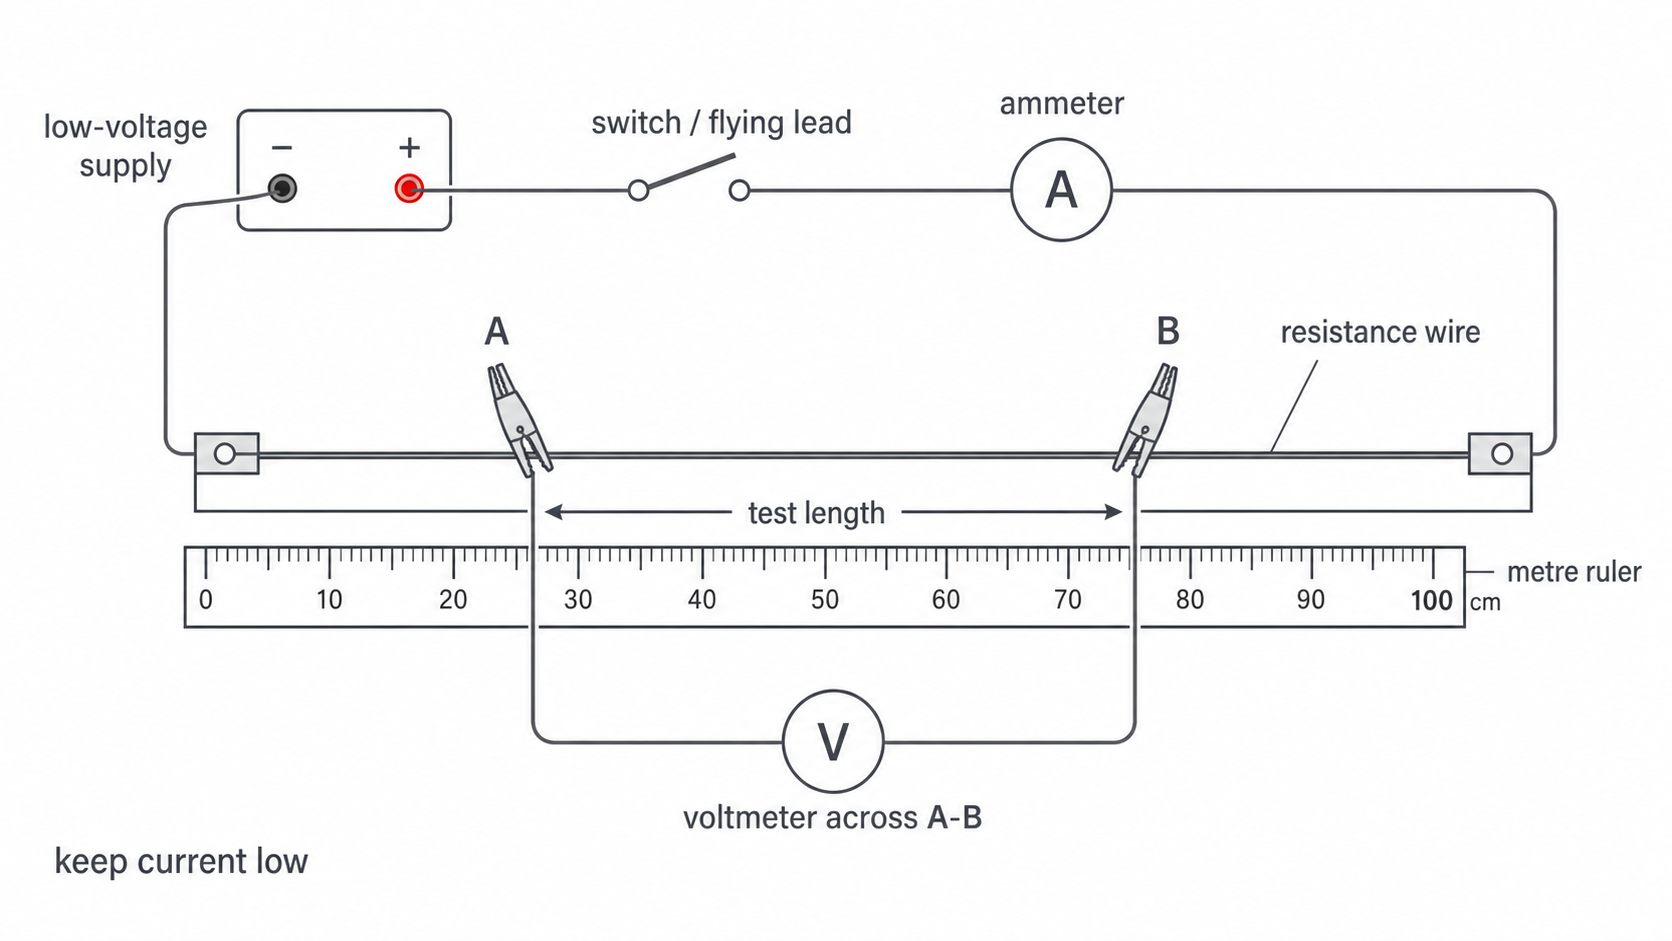
The independent variable is the length of resistance wire between the crocodile clips. The dependent variable is the calculated resistance. Important control variables are the wire material, wire thickness, temperature of the wire, and power supply setting as far as practical.
A suitable method is:
- Connect the circuit from the diagram with the power supply switched off.
- Put one crocodile clip at the zero end of the resistance wire.
- Put the second crocodile clip at the first chosen length, such as
10 cm. - Switch on only long enough to read the ammeter and voltmeter.
- Record the potential difference and current.
- Switch off or disconnect the flying lead between readings.
- Move the second crocodile clip to other lengths, such as
20 cm,30 cm,40 cm,50 cmand60 cm. - Repeat readings if time allows, then check for anomalies before calculating a mean resistance for each length.
Constant temperature matters because heating the wire can change its resistance. Use a low potential difference, take readings promptly, and disconnect the circuit between readings so the wire has less time to heat up.
Processing wire data
For each length, calculate resistance from the measured potential difference and current:
A results table should include headings and units.
| Length of wire in cm | Potential difference in V | Current in A | Resistance in Ω |
|---|---|---|---|
| 10 | 0.44 | 0.40 | 1.1 |
| 20 | 0.84 | 0.40 | 2.1 |
| 30 | 1.24 | 0.40 | 3.1 |
| 40 | 1.64 | 0.40 | 4.1 |
The example data show that resistance increases as length increases. A graph of resistance against length tests whether the relationship is linear.
[DIAGRAM: asset_name: Required Practical 3 Resistance in Circuits - diagram 2; asset_slug: 016_4_2_1_3b_required_practical_3_resistance_in_circuits_diagram2; file: diagram_assets/016_4_2_1_3b_required_practical_3_resistance_in_circuits_diagram2.png; recommended_method: deterministic_drawn; description: Exact graph-style visual of resistance in ohms against length of wire in cm. It shows example plotted points, a straight line of best fit with a small positive intercept, labelled axes with units, and annotations for linear relationship, gradient and intercept/contact resistance. Deterministic drawing is appropriate because axes, plotted data, line and labels must be exact and readable; the data are illustrative and repeated in nearby prose.]
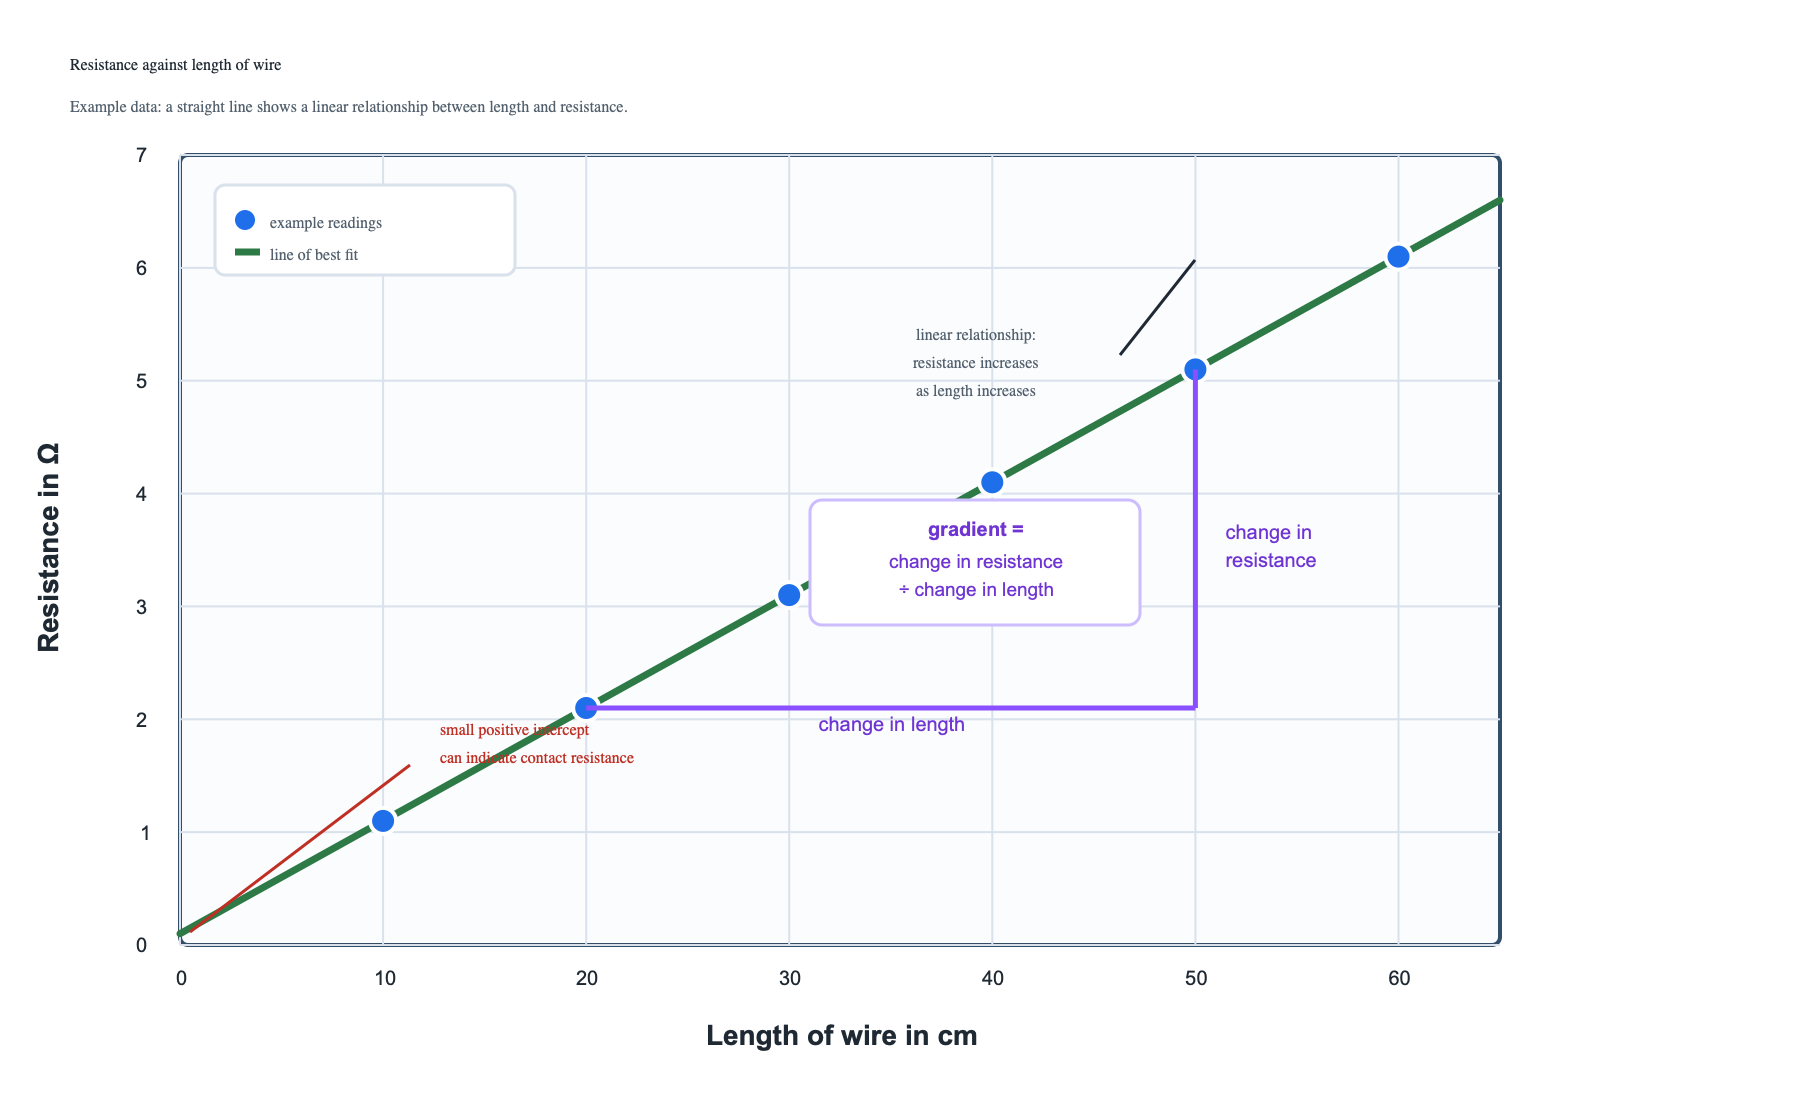
When plotting the graph:
- put length on the x-axis and resistance on the y-axis
- label both axes with quantities and units
- plot points accurately
- draw a straight line of best fit if the points show a linear trend
- use the gradient to describe how much resistance increases per unit length
- use the intercept to discuss any resistance that has not come from the measured length alone
The line of best fit may not pass through the origin. This can happen because the circuit includes small contact resistances at the crocodile clips and connecting points, or because the measured test length is not the only small resistance affecting the readings.
Use an appropriate number of significant figures in calculated resistances. Usually the answer should not have more precision than the meter readings justify.
Series and parallel method
The second activity investigates how resistor arrangement affects total resistance. The method is not just a calculation exercise: you build each circuit from a circuit diagram, check it, measure potential difference and current, then calculate total resistance.
[DIAGRAM: asset_name: Required Practical 3 Resistance in Circuits - diagram 3; asset_slug: 016_4_2_1_3b_required_practical_3_resistance_in_circuits_diagram3; file: diagram_assets/016_4_2_1_3b_required_practical_3_resistance_in_circuits_diagram3.png; recommended_method: image_gen; description: Side-by-side circuit diagrams for comparing two 10 ohm resistors in series and in parallel. Each circuit shows a low-voltage supply, switch, ammeter in series with the whole circuit, and voltmeter across the resistor combination. The diagram highlights that the measured potential difference is across the whole combination, not one resistor unless stated.]
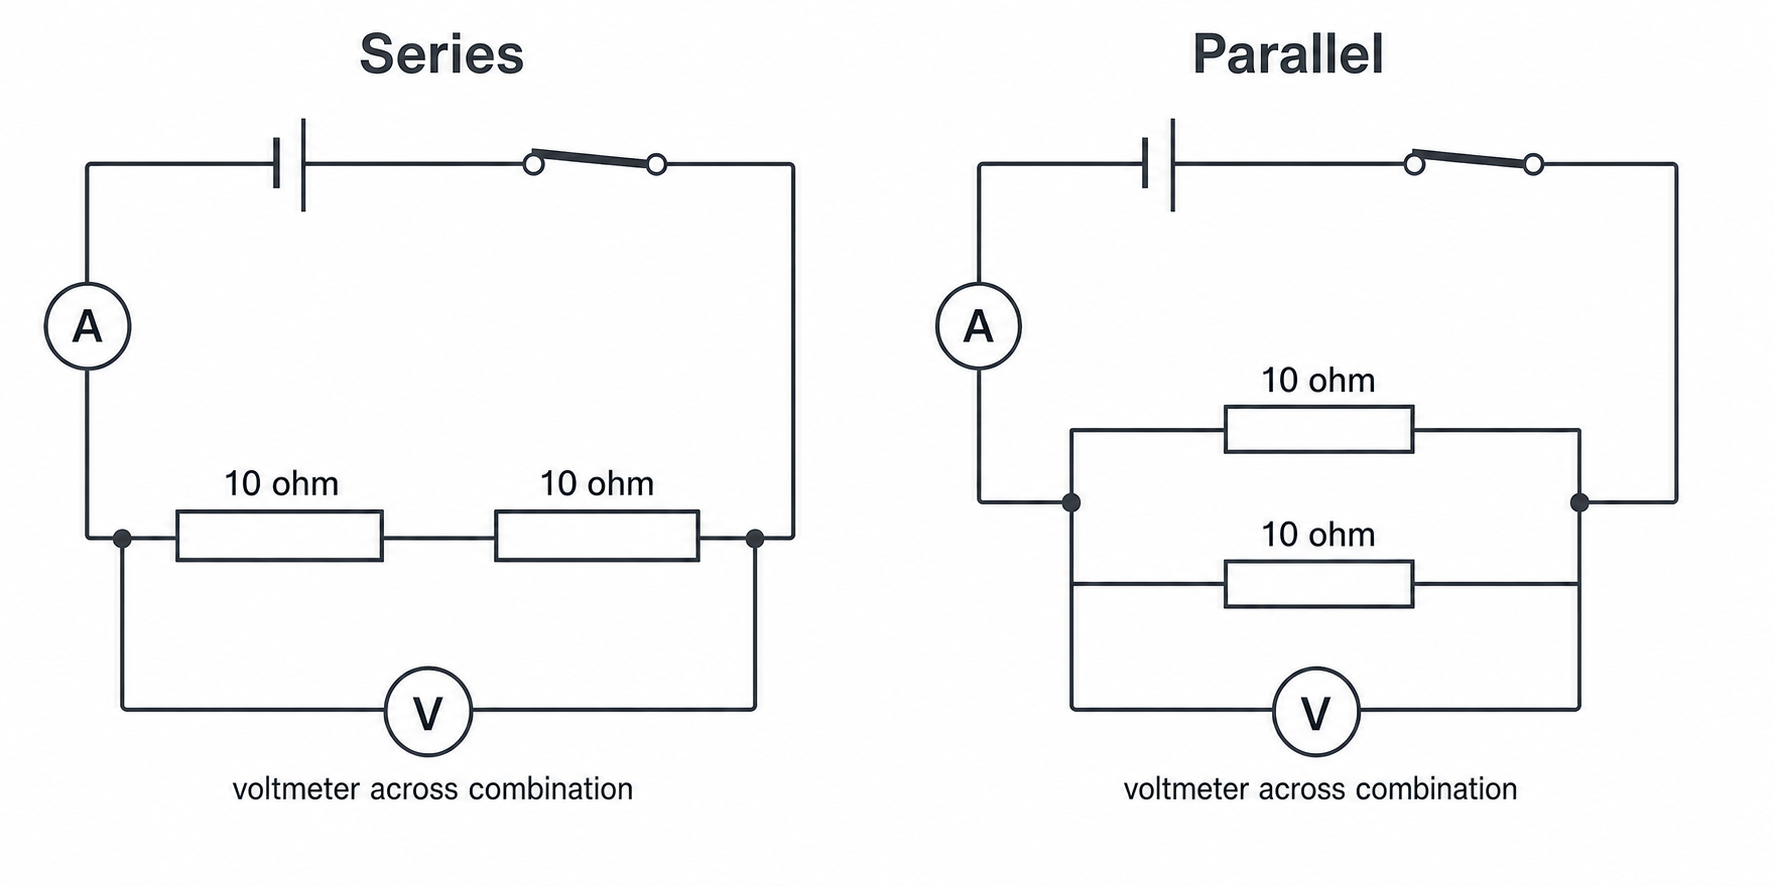
For the series circuit:
- Connect two fixed resistors in series.
- Put the ammeter in series with the whole circuit.
- Connect the voltmeter across the whole resistor combination.
- Switch on, record potential difference and current, then calculate total resistance using
R = V / I.
For the parallel circuit:
- Connect the same two resistors in parallel branches.
- Keep the ammeter in series with the whole circuit so it measures total current from the supply.
- Connect the voltmeter across the whole parallel combination.
- Switch on, record potential difference and total current, then calculate total resistance using
R = V / I.
For two identical 10 Ω resistors, the series combination should have a greater total resistance than one resistor, about 20 Ω in an ideal circuit. The parallel combination should have a lower total resistance than either individual resistor, about 5 Ω for two identical 10 Ω resistors. In the lesson and exam, the important practical conclusion is the direction of the effect: series increases total resistance; parallel decreases total resistance.
Evaluating the practical
Evaluation explains how trustworthy the results are and how the method could be improved.
| Issue | Effect on results | Improvement |
|---|---|---|
| Wire heats up | Resistance may change during a reading | Use low potential difference and switch off between readings |
| Crocodile clips make poor contact | Readings may fluctuate or add contact resistance | Clean/secure contacts and repeat readings |
| Length is read from the wrong part of the clip | Systematic error in all lengths | Measure between the actual contact points |
| Only a few lengths are tested | Weak evidence for a trend | Use a wider range with regular intervals |
| One reading per length | Random errors and anomalies are harder to identify | Repeat readings and calculate a mean after checking anomalies |
| Meters have limited resolution | Small changes may be uncertain | Choose suitable meter ranges and record values to sensible precision |
Accuracy is about closeness to the true value. Precision is about how close repeat readings are to each other. Repeatability means the same person using the same method and apparatus can get similar results again. Reproducibility means another person or method can get similar results.
A strong conclusion links the data to the hypothesis. For the wire investigation, a valid conclusion might be: as the length of the same wire increased at constant temperature, the resistance increased in a linear relationship. For the resistor investigation, a valid conclusion might be: adding resistors in series increased total resistance, while adding the same resistors in parallel decreased total resistance.
Required practical 3 is assessed through the whole chain: correct circuit setup, controlled measurements, resistance calculations, graphing, conclusions and evaluation.
Do not claim that a result is perfect just because the graph is close to a straight line. Contact resistance, heating, meter resolution and reading technique can still affect the evidence.