3.13-3.14 - Energy resources and trends
Electricity can be generated from moving water, sunlight or fuels, with different benefits and limitations. Compare the resources, follow their transfer routes and use data to distinguish a long-term trend from a short-term fluctuation.
Classifying energy sources
The electrical energy supplied to a home has to be transferred from an energy source. The source is the resource or natural process from which the energy is first obtained. Electricity is an energy carrier made from a source; electricity itself is not automatically renewable or non-renewable. The resource labels describe how the energy was supplied.
A renewable energy resource is replenished naturally on a timescale similar to, or shorter than, the timescale on which people use it. Its flow can still be limited by time, weather and location.
A non-renewable energy resource is a finite stock that is used much faster than natural processes replace it.
The main sources in this lesson are:
| Category | Source | What the source provides |
|---|---|---|
| non-renewable | fossil fuels: coal, oil and natural gas | chemical energy stored in fuels formed over millions of years |
| non-renewable | nuclear fuel, usually uranium | energy released from atomic nuclei during fission |
| renewable | bio-fuel made from recently living material | chemical energy stored by plants or other biomass |
| renewable | wind | kinetic energy of moving air |
| renewable | hydro-electricity | energy of water moving or falling from a higher level |
| renewable | tides | kinetic energy of moving seawater or energy from a tidal height difference |
| renewable | the Sun | energy transferred to Earth by radiation |
Nuclear fuel is non-renewable because usable uranium is mined from a finite stock. It is not a fossil fuel and is not burned in a combustion reaction. Bio-fuel is classed as renewable only when the biological material is replaced at least as quickly as it is used; poor land management can make its use unsustainable.
Routes to useful energy
Different sources can supply the same final use. For example, a lamp works in the same way whether the electricity entering it was generated by wind or natural gas. The source determines the earlier transfer route and many of the consequences of generating that electricity.
| Source | Main conversion route | Common uses |
|---|---|---|
| fossil fuels | fuel is burned; hot gases turn a turbine directly or thermal energy makes steam that turns a turbine and generator | electricity, heating and transport fuels |
| nuclear fuel | fission transfers energy to a thermal store; steam turns a turbine and generator | mainly electricity |
| bio-fuel | fuel is burned in a boiler, power station or engine | heating, electricity and transport |
| wind | moving air turns turbine blades connected to a generator | electricity |
| hydro-electricity | falling or flowing water turns a turbine connected to a generator | electricity |
| tides | moving seawater, or water passing through a tidal barrage, turns turbines and generators | electricity |
| the Sun | photovoltaic cells transfer energy directly to electricity; solar collectors transfer energy to thermal stores | electricity and heating |
Most large-scale electricity generation therefore uses a generator driven by a turbine. Fossil-fuel, nuclear and some bio-fuel power stations first produce thermal energy and steam. Wind, hydro-electric and tidal systems use moving air or water to turn a turbine without first heating water. Solar photovoltaic cells are different because they do not need a turbine.
Energy is conserved along every route, but not all of the transferred energy reaches the intended useful output. Some is dissipated to the surroundings, often by heating. Renewable does not mean that every joule becomes useful, and non-renewable does not mean that energy has been destroyed.
Comparing an energy mix
No single label decides whether a source is suitable. A useful comparison keeps the same criteria on both sides:
- availability and location: strong winds, large rivers, high tidal ranges and intense sunshine are not evenly distributed;
- controllability: fuel-burning and nuclear stations can operate when their fuel and plant are available, while wind and solar output depend on conditions. Many nuclear stations supply sustained output and are less suited than fast-starting gas generators to sudden changes in demand;
- predictability: tides are highly predictable but vary through the tidal cycle; weather-dependent output is less predictable;
- environmental effects: fossil-fuel combustion releases carbon dioxide and may release other pollutants; nuclear operation produces radioactive waste; renewable installations can affect land, habitats and waterways;
- construction and running requirements: every source needs equipment and maintenance, while fuel-burning and nuclear stations also require a continuing fuel supply.
Wind turbines, hydro-electric stations, tidal systems and solar cells do not release carbon dioxide while generating electricity, because they do not burn fuel. That does not mean they have no environmental impact: manufacturing, construction, land use and habitat changes still matter.
Fossil fuels are useful when a controllable supply, heating or transport fuel is needed, but their finite reserves and carbon dioxide emissions are disadvantages. Nuclear stations also use a finite fuel, yet reactors do not produce carbon dioxide during operation; their distinct disadvantage is radioactive waste that must be isolated and managed. Bio-fuels can be stored and used when required, but burning them releases carbon dioxide and other pollutants. Replanting can absorb carbon dioxide later, but only if the crop is genuinely replaced and the full system is managed sustainably.
An energy mix combines sources so that their strengths can cover one another's limitations. A system may use variable renewable generation when it is available and retain controllable sources for periods when demand is high or renewable output is low. Energy storage or connections to other networks can also help. A reservoir can store water for later generation, whereas a run-of-river hydro station depends more directly on current flow.
Reading resource trends
A pattern is a feature in the data, such as a rise, fall, plateau, fluctuation or crossover. A trend is the overall direction across several observations. One change between adjacent years may be important, but it should not be mistaken for the long-term trend.
The graph below uses UK annual data. The horizontal axis gives the calendar year; the vertical axis gives the percentage of total UK electricity generation. Each point therefore represents the share generated from that resource category during one year. The non-renewable share is calculated as 100% - renewable share, so the two values add to 100% in each year.
[DIAGRAM: asset_name: 12_1PH0-P1-03D_3.13-3.14 - Energy resources and trends - diagram 01; asset_slug: edexcel-gcse-physics-1ph0-p1-03d-energy-resources-trends_diagram_01; recommended_method: matplotlib; description: Exact line graph of official DUKES 2026 UK electricity-generation shares from 2010 to 2025, with separate renewable and complementary non-renewable series, labelled axes and values.]
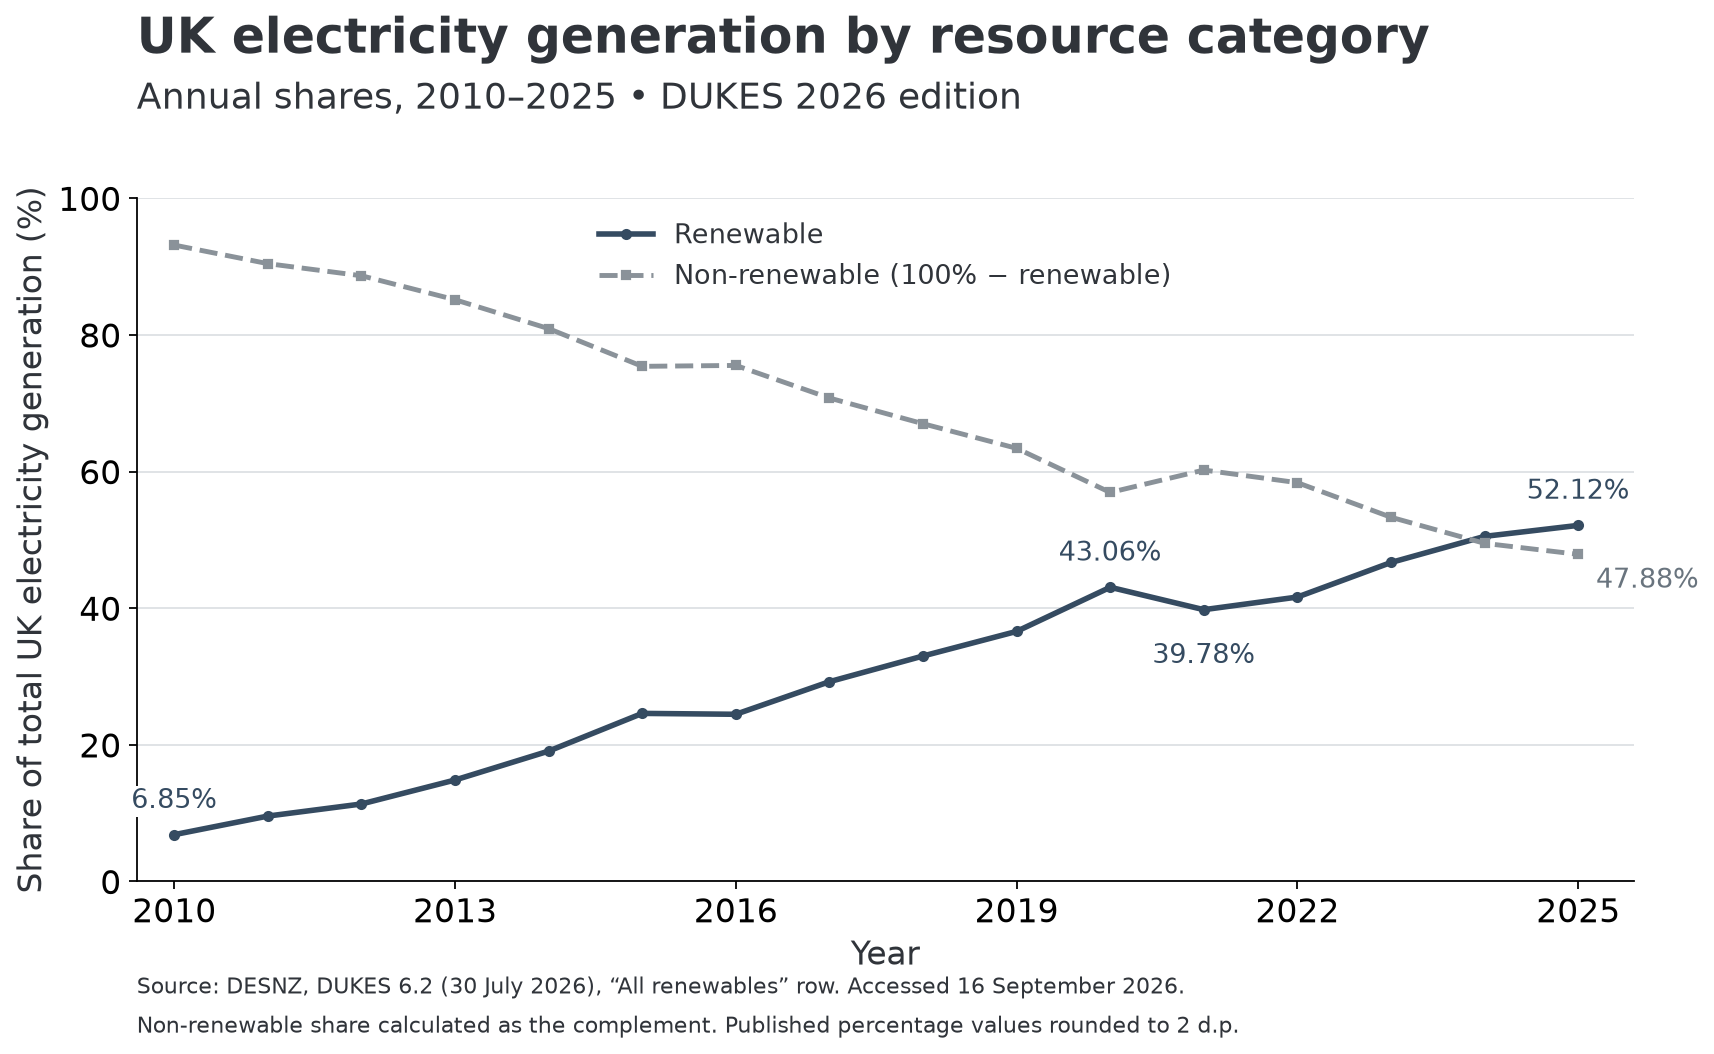
Read the graph in layers:
- Overall direction: the renewable share rose from
6.85%in 2010 to52.12%in 2025, while the non-renewable share fell from93.15%to47.88%. - Size of change: the renewable share increased by percentage points, or about
45.3percentage points. This is a difference between two shares, not a45.3%relative increase. - Fluctuations: the renewable share fell from
43.06%in 2020 to39.78%in 2021, then rose again. The one-year fall does not remove the upward trend across 2010-2025. - Crossover: the renewable share first exceeded 50% in 2024 in this series (50.51%) and was 52.12% in 2025. The non-renewable category includes nuclear generation, so it is not the same as fossil fuels alone.
The data come from the Department for Energy Security and Net Zero, DUKES 6.2, 2026 edition, published 30 July 2026 and checked on 16 September 2026. The plotted percentages are the published “All renewables” row, with the other category calculated as its complement. Treat this as a dated data set: learn to interpret the evidence rather than memorising its proportions. These are UK data, so the exact pattern should not be assumed for every country or for total energy uses such as transport and heating.
Explaining changing use
A strong explanation goes beyond naming a line's direction. It links evidence to a mechanism:
observed change -> named source or category -> reason that could cause the change
For example: the renewable share increased; wind and solar capacity grew; more installed generators could transfer more wind and solar energy to electricity. This is stronger than saying only that renewables are better.
Several mechanisms can change how resources are used:
- new power stations or renewable capacity are built, while older stations close;
- rules, investment and climate targets encourage sources with lower direct carbon dioxide emissions;
- fuel prices and fuel availability change the cost of running fossil-fuel or nuclear stations;
- improvements in technology reduce construction or generation costs;
- electricity demand changes, so a source's amount or share can change even if its own output stays similar;
- wind speed, sunshine, rainfall and outages create short-term fluctuations in annual generation.
The graph alone cannot prove which mechanism caused a change. A defensible explanation must use relevant contextual evidence, such as installed capacity, fuel prices, weather records, station closures or policy dates. It must also fit the place: countries have different resources, geography, existing power stations and decisions.
Describe first, then explain. Name the overall trend and any important fluctuation from the data; after that, connect the change to a named source and a plausible mechanism. Renewable does not mean constant or impact-free, and non-renewable use does not have to fall every year.