2.27-2.31 - Reaction times and stopping distance
A car travels while its driver reacts and again while it brakes. Learn to measure reaction time, explain changes in stopping distance and understand why sudden stops are dangerous. Only the final numerical force-estimation section is Higher tier.
Measuring reaction time
Imagine a traffic light changes to red. The driver's foot does not move onto the brake pedal at exactly the same instant. The nervous system must detect the change, process it and begin a response.
Reaction time is the time interval between detecting a stimulus and beginning the response to it. It is measured in seconds, s.
Ruler-drop method
Two people can estimate reaction time with a 30 cm ruler.
- The person being tested holds their thumb and first finger open, with the
0 cmmark level with the top of the thumb. - A partner holds the ruler vertically and releases it after an unpredictable delay. They do not give a warning or push the ruler down.
- The person closes their finger and thumb as soon as they see the ruler fall.
- Record the distance the ruler fell before it was caught. Use a reaction-time conversion chart or calibrated ruler scale to convert this distance into a time.
- Repeat several times under the same conditions and calculate the mean reaction time.
[DIAGRAM: asset_name: 07_1PH0-P1-02F_2.27-2.31 - Reaction times and stopping distance - diagram 01; asset_slug: 07_1ph0-p1-02f_2-27-2-31-reaction-times-and-stopping-distance_diagram_01; recommended_method: image_gen; description: Exact aligned ruler-drop schematic: hand reference height stays fixed, the ruler translates down20cm, and the catch reading is20cm; all centimetre ticks are evenly spaced]
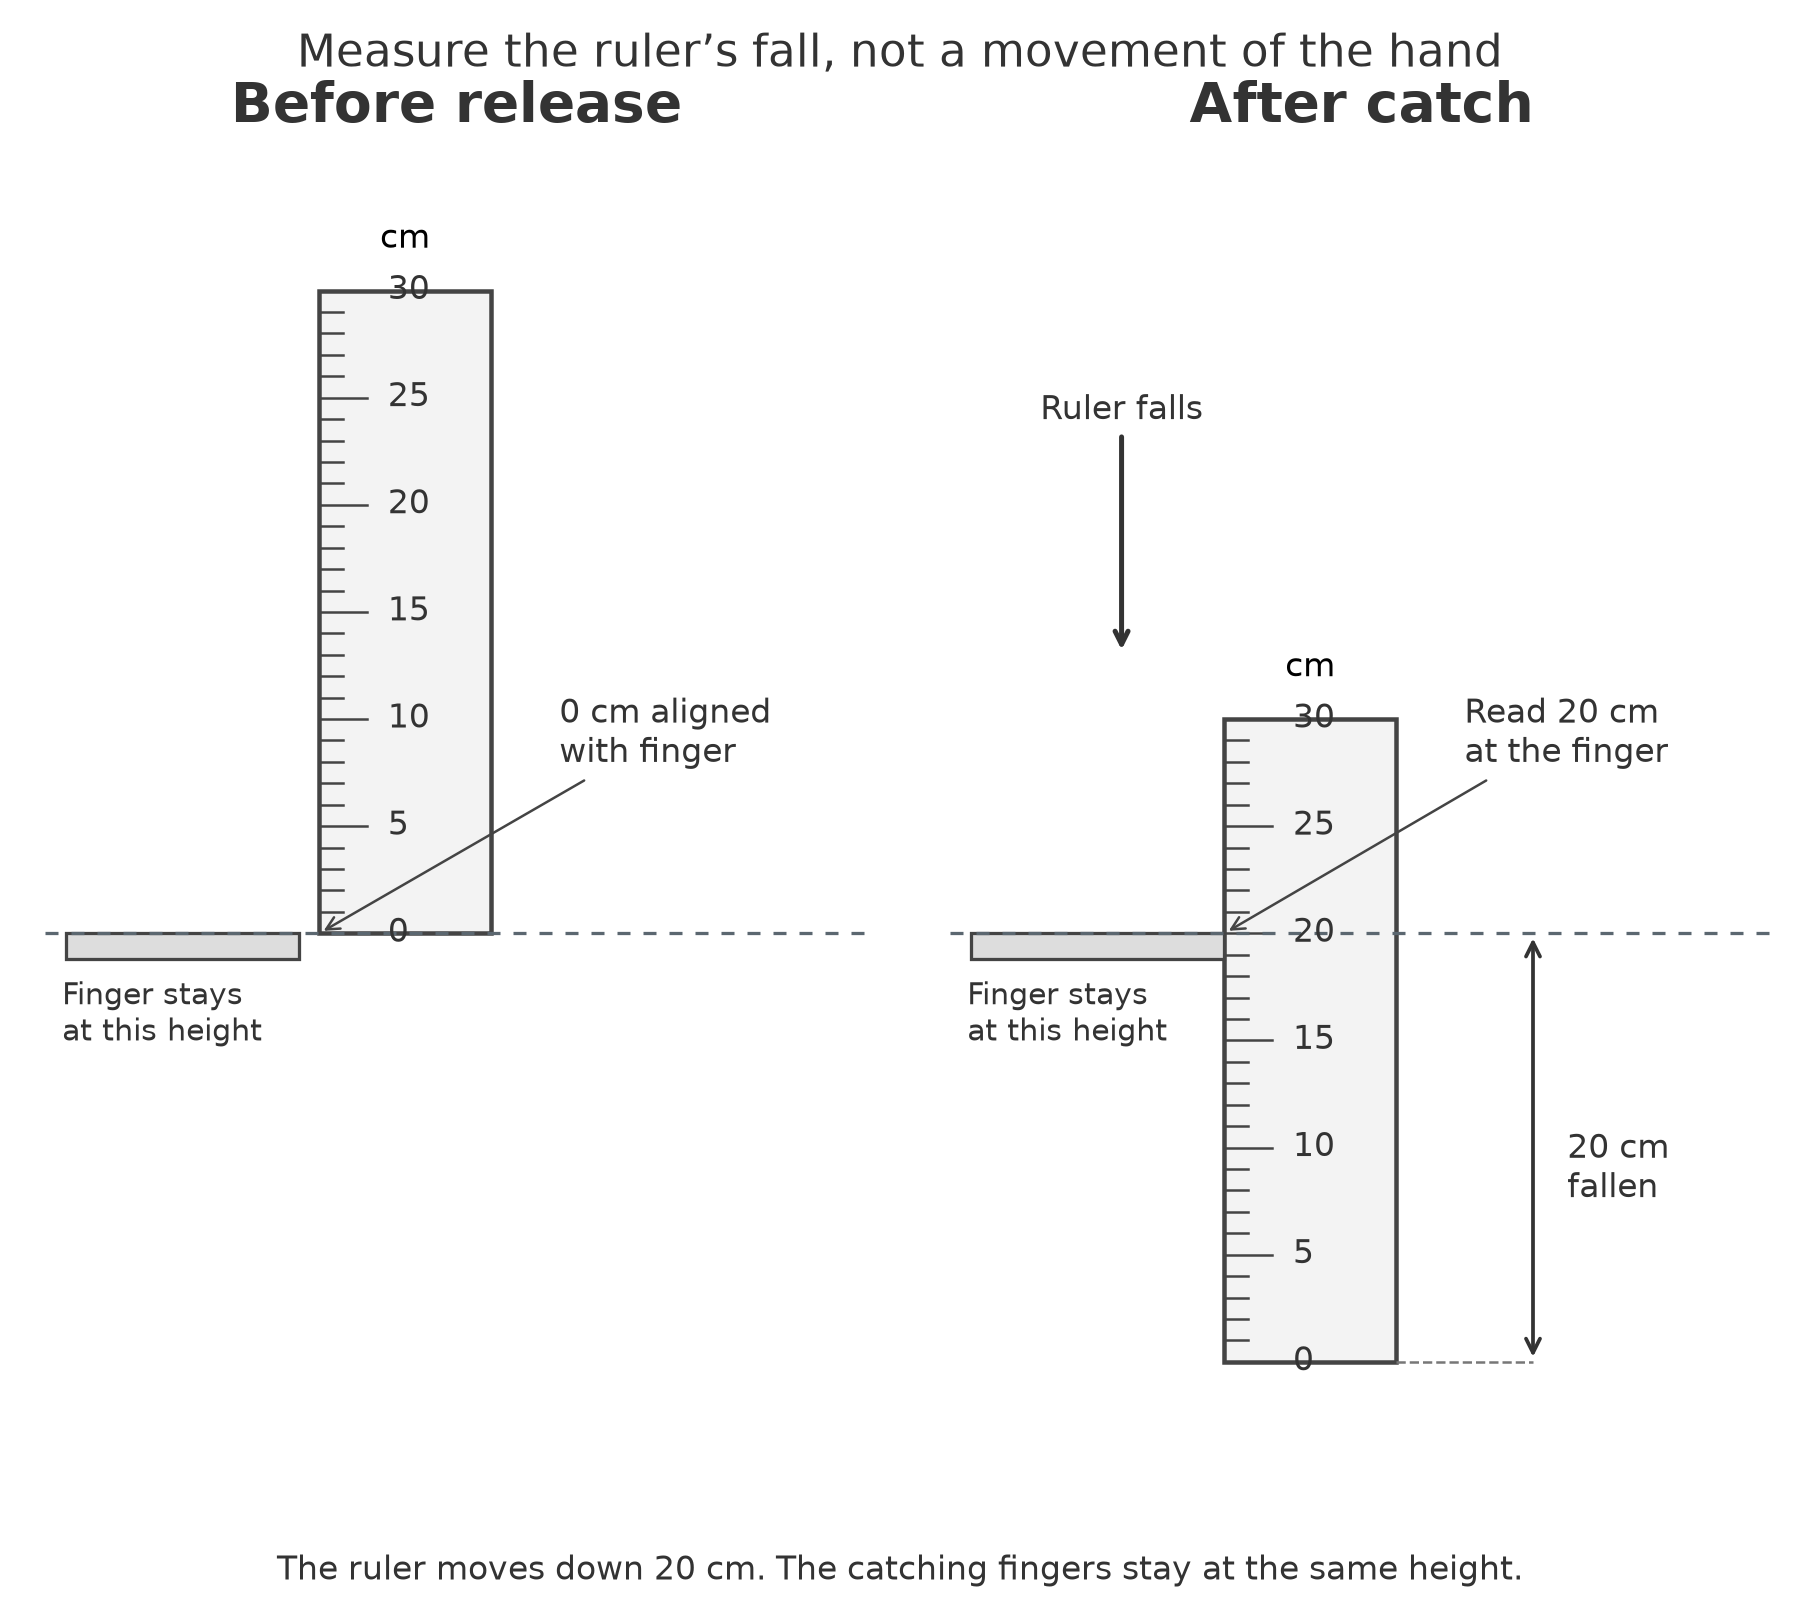
The ruler reading is a distance, not a time. A longer fall distance means a longer reaction time. The unpredictable release delay reduces anticipation; repeats and a mean reduce the effect of random variation between attempts.
Electronic method
A computer or phone can show a light or make a sound after a random delay. The person presses a key as soon as the stimulus appears, and the software measures the interval between stimulus and response. Repeating the test and finding a mean gives a more representative value.
In a simple laboratory test, a useful typical human result is about 0.2 s; a value of a few tenths of a second is plausible. This is not a fixed value for every person or task. The type of stimulus, practice, tiredness and distractions can all change the result.
In the diagram, the horizontal reference line stays at the same height: the ruler falls, while the catching fingers close without moving up to meet it. Keep that reference height unchanged between release and catch. A 20 cm drop corresponds to about 0.20 s when ; a supplied conversion chart avoids mistaking centimetres for seconds. A ruler longer than 30 cm is useful if slower responses cause frequent missed catches.
The two stages of stopping
A vehicle does not begin slowing at the instant a driver sees a hazard. Its total stopping distance has two consecutive parts, separated by the instant the brakes begin to act.
[DIAGRAM: asset_name: 07_1PH0-P1-02F_2.27-2.31 - Reaction times and stopping distance - diagram 02; asset_slug: 07_1ph0-p1-02f_2-27-2-31-reaction-times-and-stopping-distance_diagram_02; recommended_method: image_gen; description: Monochrome road sequence with three car positions marking hazard noticed, brakes applied and rest, with thinking and braking distance arrows clearly separated]
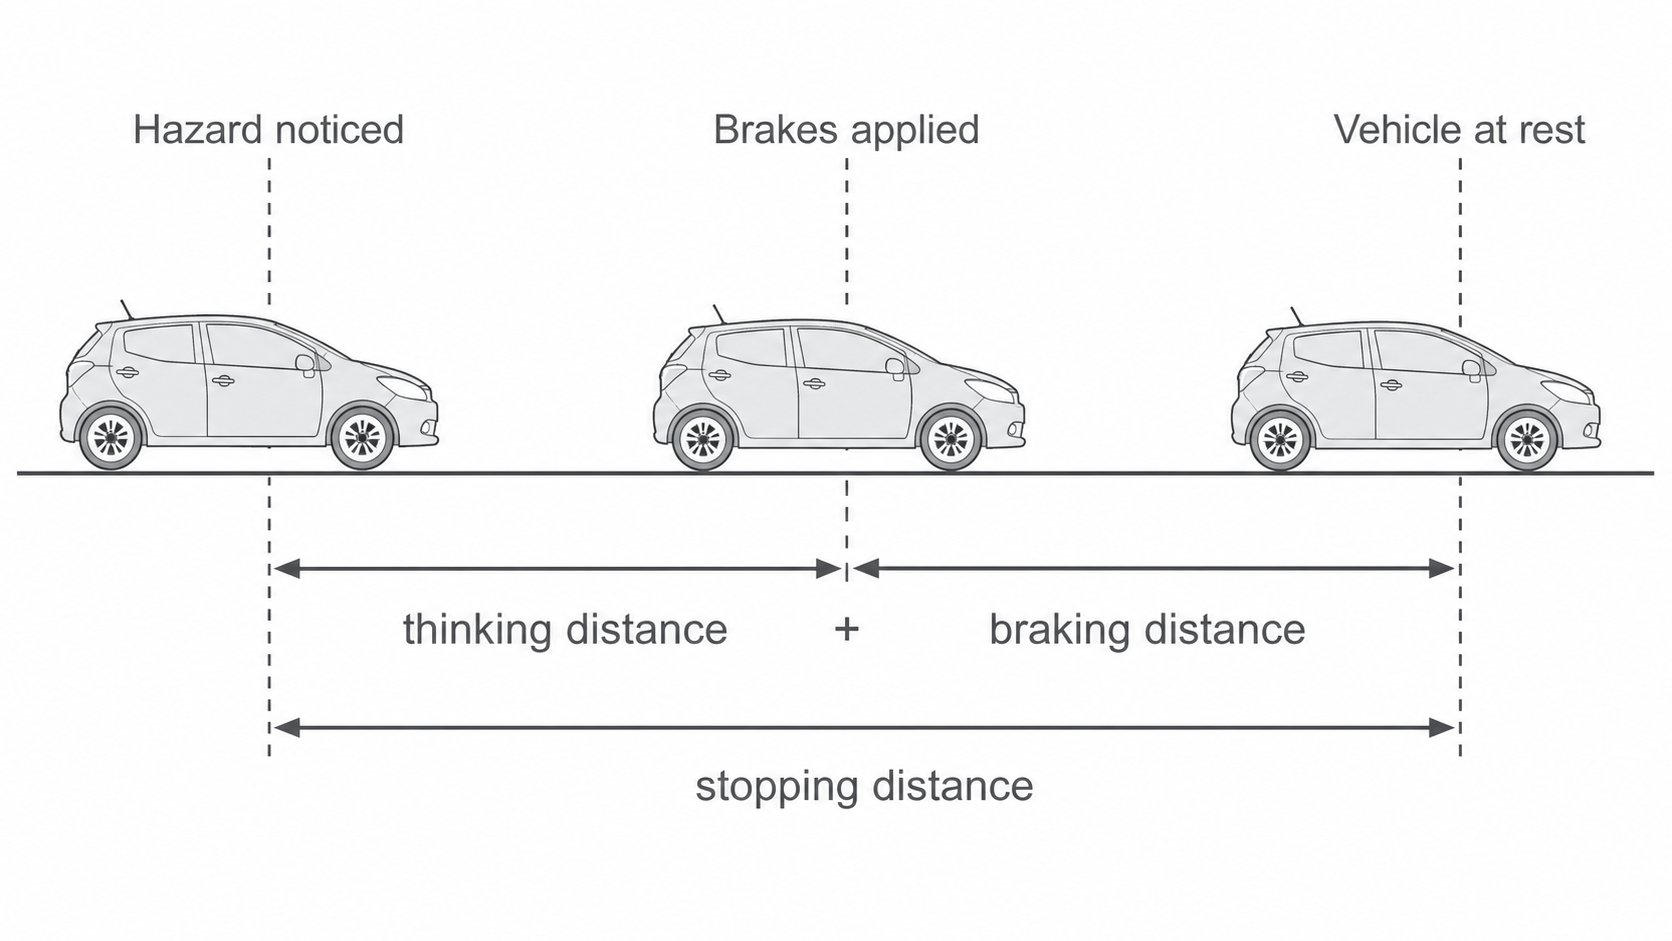
Thinking distance is the distance travelled from the driver detecting the hazard until the brakes begin to act.
Braking distance is the distance travelled from the brakes beginning to act until the vehicle comes to rest.
These two distances occur one after the other, so their lengths are added.
stopping distance = thinking distance + braking distance
During the reaction interval, a simple model treats the vehicle's speed as constant. This gives:
thinking distance = speed × reaction time
Worked example
A car travels at 15 m/s. The driver's reaction time is 0.24 s, and the braking distance is 24 m. Find the stopping distance.
The speed is already in m/s and the time is in s, so no unit conversion is needed.
thinking distance = 15 m/s × 0.24 s = 3.6 m
Now add the two consecutive distances:
stopping distance = 3.6 m + 24 m = 27.6 m
To two significant figures, the stopping distance is 28 m. This is sensible: the answer must be greater than the 24 m braking distance because the car also travels while the driver reacts.
Do not use stopping distance and braking distance as if they mean the same thing. Braking distance is only the second part of the total.
Why stopping distance changes
Every factor must be connected to the stage that it changes.
| Factor | Physical effect | Distance affected |
|---|---|---|
| Greater speed | The vehicle covers more distance during the same reaction time. It also begins braking at a greater speed and needs a greater change in velocity before it stops. | Thinking and braking distances both increase. |
| Longer driver reaction time | The brakes start later, so the vehicle continues at its original speed for longer. | Thinking distance increases. |
| Greater vehicle mass | For the same braking force, means a larger mass has a smaller deceleration. A more heavily loaded vehicle therefore generally needs more distance unless its braking force increases in proportion. | Braking distance generally increases. |
| Worn, damaged, wet or overheated brakes | The brakes may provide a smaller braking force. | Braking distance increases. |
| Wet, icy, loose or contaminated road | There is less friction, or grip, between the tyres and the road, so the maximum braking force is smaller and skidding is more likely. | Braking distance increases. |
| Poor tyre condition | Worn tread or unsuitable tyres can reduce grip, especially when the road is wet. | Braking distance increases. |
The condition of the road and tyres matters because the braking force must be transmitted through the contact between tyre and road. Good brakes cannot create full deceleration if the tyres cannot grip the surface.
A factor that changes the driver’s reaction time changes thinking distance. A factor that changes the braking force or tyre-road grip changes braking distance. Speed can change both.
Why reaction time changes
Reaction time depends on the person and the situation. Factors that can make a driver's response slower include:
- alcohol, illegal drugs and some medicines, which can impair judgement, coordination and the nervous system's response;
- tiredness, which reduces alertness;
- distractions, such as looking at a phone, adjusting a screen, eating, loud conversation or trying to read a map;
- illness, age or unfamiliarity with the situation, which can affect some people's response times.
A distraction may take the driver's eyes from the road, their mind from the driving task, or their hands from the controls. The important physics link is a causal chain:
distraction -> delayed response -> longer reaction time -> longer thinking distance -> longer stopping distance
Drugs and distractions do not directly reduce the mechanical friction between the tyres and road. Brake condition and road grip belong to the braking stage; the driver's response belongs to the thinking stage.
Why sudden stops are dangerous
Choose the vehicle's original direction as positive. When it slows, its acceleration is negative because the acceleration is opposite to its velocity. Deceleration describes this slowing; a large deceleration means a large magnitude of negative acceleration.
A large change of velocity in a very short time produces a large deceleration. The associated force on a person can damage tissues and bones. The danger and the role of restraints are required at both tiers.
Without a restraint, the passenger continues moving forwards until the dashboard, windscreen or another object exerts a force. Safety features make the change in velocity happen more safely:
- a seat belt restrains the passenger, increases the time and distance over which the passenger stops compared with striking a hard surface, and spreads force across stronger parts of the body;
- an airbag increases the stopping time and area over which force acts, but supplements rather than replaces the seat belt;
- a crumple zone deforms, increasing the time over which the vehicle stops.
For the same mass and velocity change, a longer stopping time gives a smaller acceleration magnitude. From , the resultant force magnitude is then smaller. The safety feature does not remove the force; it controls how rapidly the person's velocity changes and how the force acts on the body.
Higher tier: Estimating collision forces
Higher tier: estimating road-collision forces (2.31). Choose the passenger as the object, then combine these two relationships:
acceleration = change in velocity / time taken
force = mass × acceleration
The sign gives direction. When an estimate asks for the size of a force, report its positive magnitude and then state its direction in words.
Worked example: force on a passenger
A 72 kg passenger is travelling forwards at 13 m/s, about the speed of a car on a 30 mph road. During a collision, the passenger's velocity changes to zero in 0.10 s. Estimate the average resultant force on the passenger. Assume constant acceleration during this short interval.
The values are already in kg, m/s and s.
, ,
To two significant figures, the average resultant force has magnitude , directed opposite to the passenger's original motion. A force of several thousand newtons is plausible in a short road collision and can damage body tissues and bones.