2.5 - 2.7 - Growth and differentiation
Explain how division, elongation and differentiation build growing organisms. Then use percentile charts to distinguish absolute growth from a child’s changing position in a reference group.
2.5–2.6 — Building a Growing Organism
Increasing cell number is necessary for growth, but it is not enough to build a working organism. A tissue needs cells suited to particular jobs, so some newly produced cells must also change their structure and function.
Cell differentiation
Cell differentiation is the process by which a cell becomes specialised to carry out a particular function.
Differentiation is important because specialised cells can perform different jobs within tissues and organs. For example, muscle cells carry out contraction while nerve cells transmit electrical impulses. These cells can contain matching chromosome sets yet develop different structures and functions. Without differentiation, division would make more cells but would not produce the range of specialised cells needed for a multicellular organism to function.
Growth combines these processes differently in animals and plants:
| Organism | Processes involved in growth | Contribution of each process |
|---|---|---|
| Animals | Cell division and differentiation | Division increases cell number; differentiation produces specialised cells for different tissues and organs. |
| Plants | Cell division, elongation and differentiation | Division increases cell number; elongation makes newly formed cells longer or larger; differentiation produces specialised plant cells. |
A growing root shows the plant sequence clearly. Cells near the root tip divide to make more cells. Newly formed cells then elongate, increasing the length of the root, and differentiate so that they can perform specialised functions. Elongation changes the size of existing cells; it does not mean that one cell has divided into more cells.
2.7 — Reading percentile charts
A child's height, mass or another body measurement changes with age. A raw value such as a height of 110 cm is therefore hard to interpret on its own. A percentile chart compares that measurement with measurements from a large reference group of children of the same age and sex.
Percentile
A percentile places a measurement within a reference group. On the Nth percentile, about N% of that group have a measurement at or below that value.
For example, a height on the 25th percentile means that about 25% of the reference group of the same age and sex have a height at or below it, while about 75% have a greater height. It does not mean that the child is 25% of an expected height or that the child has grown by 25%.
The 50th percentile is the middle of the ranked reference measurements: half are at or below it and half are at or above it. It is not a target that every child should reach. A percentile describes relative position in a reference distribution; by itself, it does not decide whether a child is healthy.
Worked comparison: percentage change is not a percentile
Suppose a child's mass rises from 8.0 kg to 10.0 kg. The gain is 10.0 − 8.0 = 2.0 kg. Percentage gain compares that change with the starting mass: (2.0 ÷ 8.0) × 100 = 25%. If mass instead falls from 10.0 kg to 9.0 kg, the percentage loss is (1.0 ÷ 10.0) × 100 = 10%. Always divide by the starting value. Neither calculation tells you a percentile: that requires comparison with other children of the same age and sex.
To read a percentile chart reliably:
- Check that the chart is for the correct measurement and reference group.
- Find the child's age on the horizontal axis.
- Find the measured value and unit on the vertical axis.
- Locate the point where the age and measurement meet.
- Read the labelled percentile curve through the point, or report that the point lies between two curves.
[DIAGRAM: asset_name: 2.7-2.9 - Growth charts and stem cells - diagram 01; asset_slug: edexcel-gcse-biology-2-7-growth-percentile-patterns; recommended_method: matplotlib; description: Create an original deterministic simplified height-for-age percentile chart using synthetic teaching data, clearly labelled "Simplified teaching data - not for clinical use". Use a white background with #6A6B6E axes, curves, markers, labels and text. The x-axis is Age (years), marked 1 to 5; the y-axis is Height (cm), spanning enough of 70 to 115 cm for all points. Plot three non-intersecting curves with direct labels: 25th percentile at (1,72), (2,82), (3,91), (4,98), (5,105); 50th percentile at (1,75), (2,85), (3,95), (4,102), (5,109); and 75th percentile at (1,78), (2,88), (3,99), (4,106), (5,113). Plot and connect one child's measurements at (1,75), (2,85), (3,91), (4,98), using a marker style distinct from the percentile curves and label the series "example child". Make exact plotted values readable without clutter and visually show that height rises while the child shifts from the 50th to the 25th percentile. Do not imitate an official RCPCH, WHO, CDC or Pearson chart, do not add clinical thresholds, diagnoses, decorative elements or additional percentiles.]
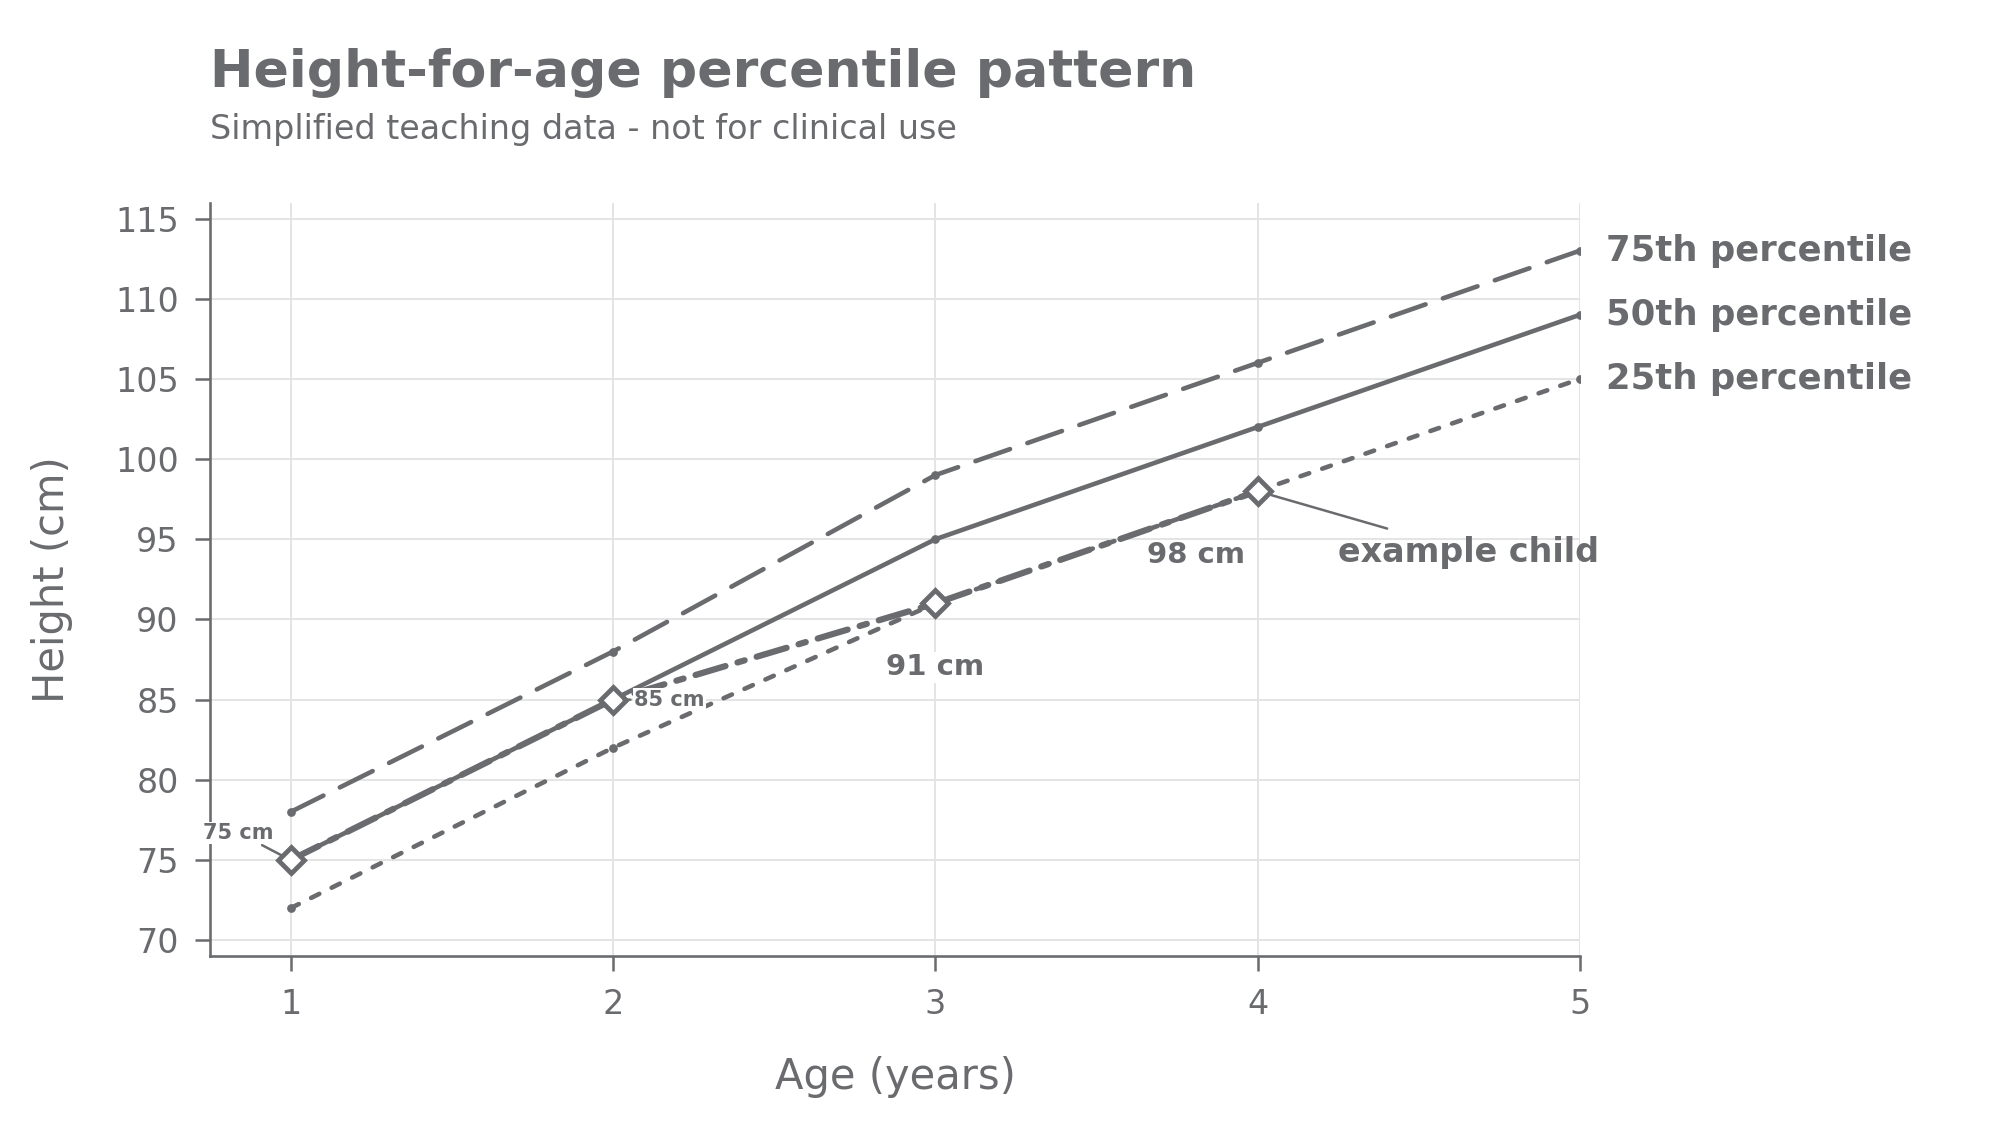
In the simplified chart, the example child's height increases at every measurement. However, the child's relative position changes from the 50th percentile to the 25th percentile because the reference heights increase more quickly over that interval. Absolute growth and percentile position are related, but they are not the same quantity.
2.7 — Monitoring growth patterns
To monitor growth means to collect and compare measurements over time. A single point shows position at one age. A series of points shows whether the child is staying in a similar relative position, moving across percentile curves, or showing an irregular pattern.
Repeated measurements are only useful if they are trustworthy. The age must be correct, the same type of measurement must be compared, the unit must be checked, and the measuring method should be consistent. An unusual point could result from a recording or measurement error, so it should be checked before a biological explanation is proposed.
A steady path near one percentile suggests a consistent position relative to the reference group. A sustained movement across percentile spaces may prompt a health professional to recheck measurements and consider other information. The chart can reveal a pattern worth investigating, but it cannot by itself diagnose a condition or prove what caused the pattern.