1.10 - 1.11 - Investigating enzyme activity
Investigate how pH affects the breakdown of starch by amylase. Plan valid measurements, understand the iodine endpoint and calculate enzyme activity from reaction times or product measurements.
1.10 — Core practical: pH and amylase
An enzyme is a biological catalyst: it speeds up a reaction without being used up. Its substrate binds at the active site. pH can change how effectively the active site binds its substrate, so changing pH can change the reaction rate.
The biological question is: how does pH affect the rate at which amylase breaks down starch? Amylase is the enzyme, starch is the substrate, and smaller sugars are the products. Iodine is used to detect starch; it is not used to measure the sugar product.
Variables and measurements
- Independent variable: pH, changed with buffer solutions covering a suitable range.
- Dependent variable: the time in seconds until starch is no longer detected. This is converted to relative rate using
1 / time. - Controlled variables: temperature; volume and concentration of amylase; volume and concentration of starch; volume of buffer; sampling interval; and the mixing method.
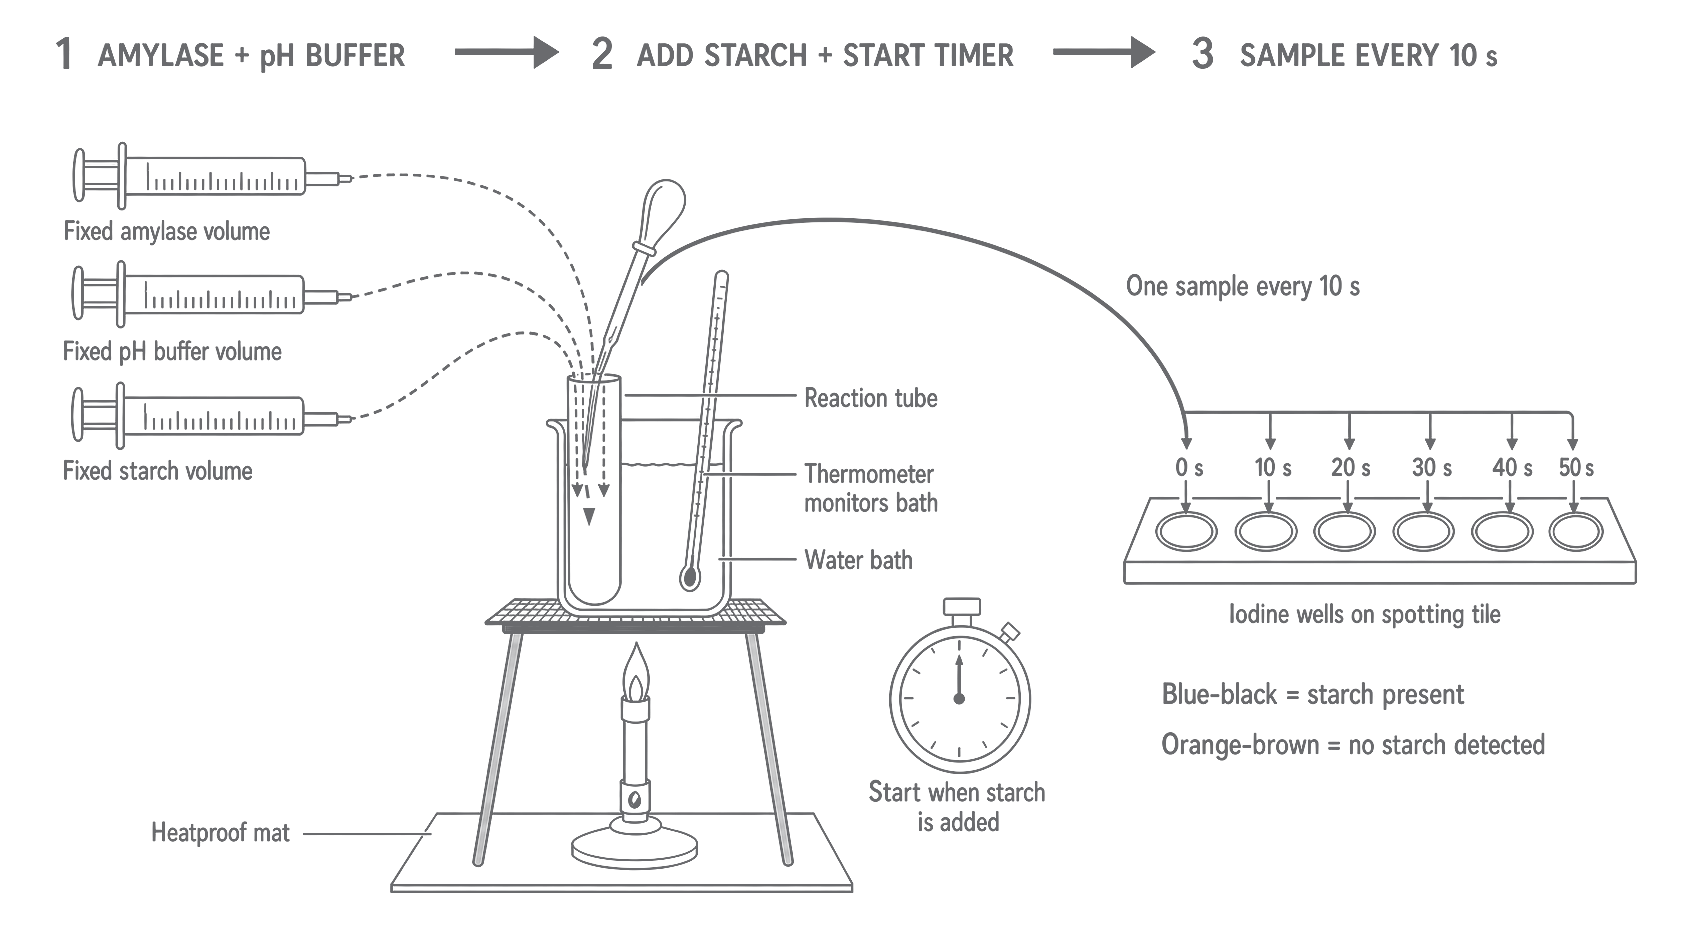
Use a heated water bath to control temperature. For the specified Pearson arrangement, a Bunsen burner heats a beaker of water and the reaction tubes stand in that water. A thermometer monitors the water temperature, while adjusting the heated water bath maintains it; a thermometer alone does not control temperature.
Apparatus and method
Use a spotting tile, iodine solution, labelled test tubes, buffer solutions, amylase solution, starch solution, clean syringes or pipettes, a stop clock, a thermometer, and the Bunsen-heated beaker of water on a heatproof mat.
- Place one drop of iodine solution into each of a row of wells on a spotting tile.
- Measure a fixed volume of amylase and a fixed volume of one pH buffer into a labelled test tube. Use dedicated, labelled syringes for different solutions to avoid cross-contamination.
- Place the amylase-buffer tube and a separately measured fixed volume of starch in the heated water bath for the same equilibration time.
- Add the starch to the amylase-buffer mixture, start the timer immediately and mix in the same way for every pH.
- Every 10 seconds, use a clean pipette to transfer one drop of the reaction mixture to the next iodine well. If starch is present, the iodine turns blue-black. When no starch is detected, the iodine remains orange-brown.
- Record the first sampling time at which the iodine remains orange-brown. Keep iodine on the spotting tile rather than adding it to the reaction tube.
- Repeat the method across the chosen pH values, with at least three repeats at each pH. Investigate any anomalous result and calculate a mean from justified repeat values.
Wear eye protection because iodine solution may irritate the eyes, follow the hazard information supplied with the buffers, and take care around the Bunsen burner, hot water and hot glassware. Keep the heatproof mat and apparatus stable, and do not handle the hot beaker directly.
[DIAGRAM: asset_name: 1.7-1.12 - Enzymes and reaction rates - diagram 02; asset_slug: edexcel-gcse-biology-1-7-1-12-ph-amylase-continuous-sampling; recommended_method: image_gen; description: Monochrome Pearson-aligned apparatus and process schematic for the pH-amylase core practical. Show a Bunsen burner on a heatproof mat heating a beaker of water, a labelled reaction test tube standing in the water, a thermometer monitoring the bath, a stop clock, syringes for fixed amylase/buffer/starch volumes, and a pipette transferring samples at fixed 10-second intervals to successive iodine wells on a white spotting tile. Label the observations in words: blue-black means starch present; orange-brown means no starch detected. Show the order amylase plus buffer, then starch and start timer, then repeated sampling. Do not show iodine inside the reaction tube, an electric water bath, food tests other than iodine for starch, numerical results or decorative laboratory equipment.]
Validity, controls and limitations
A separate control tube in which the amylase is replaced by an equal volume of water should continue to give a blue-black iodine result over the same period. It checks that starch disappearance depends on active amylase while keeping the total liquid volume comparable. This control setup is different from the controlled variables that are kept constant in every pH trial.
Sampling every 10 seconds limits the endpoint resolution. If the 40-second sample is blue-black and the 50-second sample is orange-brown, the true endpoint lies somewhere between 40 and 50 seconds even though 50 seconds is recorded. A shorter fixed sampling interval would narrow this uncertainty. Repeats and a mean reduce the influence of random timing or sampling variation, while a standard comparison well and consistent lighting make the colour judgement more consistent.
For processing, calculate 1 / mean time for each pH and plot pH on the x-axis against rate in on the y-axis. The pH with the highest measured mean rate is the best estimate of the optimum among the pH values tested; widely spaced pH values cannot establish the exact optimum.
1.11 — From time to rate
A rate compares a measured change with the time taken. The unit depends on what is measured: for example, could describe product volume formed per second. In the amylase practical, every trial starts with the same fixed quantity of starch and ends when that starch is no longer detected, so reciprocal time gives a relative rate.
Enzyme activity rate
For the same fixed endpoint:
If time is measured in seconds, the reciprocal-time unit is . A shorter endpoint time must give a larger rate; this is a useful sense-check.
Worked example
In a separate run using a fixed 5-second sampling interval, the recorded endpoint times at one pH are 45 s, 50 s and 55 s. Calculate the mean time and relative rate, giving the rate to 2 significant figures.
The requested quantities are mean time in seconds and relative rate in .
The time is already in seconds, so no unit conversion is needed. Substitute the mean into the reciprocal-time relationship:
The result is sensible: a 50-second endpoint corresponds to 0.020 fixed endpoints per second, and a longer endpoint time would produce a smaller reciprocal rate.
Now consider processed results from three pH values:
| pH | Mean endpoint time (s) | Relative rate () |
|---|---|---|
| 4 | 125 | 0.0080 |
| 6 | 50 | 0.020 |
| 8 | 100 | 0.010 |
The highest rate in these data is 0.020 at pH 6, so pH 6 is the optimum of the values tested. The data show rate rising from pH 4 to pH 6 and falling from pH 6 to pH 8. They do not prove that the exact optimum is 6.0 because no intermediate pH values were tested.