1.16 - 1.17 - Osmosis practical
Investigate how sucrose concentration changes potato mass. Use a controlled method, calculate percentage gains and losses and interpret the concentration at which there is no net water movement.
1.16 — Core practical: potato osmosis
In osmosis, water moves through a partially permeable membrane from higher to lower water concentration. More dilute sucrose solution has a higher water concentration. Net water entry increases potato mass; net water loss decreases it. At an isotonic concentration, water still moves both ways but there is no net movement.
The biological question is: how does sucrose concentration affect the percentage change
in mass of potato tissue? Use that mechanism to make a prediction. As
sucrose concentration rises, water concentration outside the cells falls, so the percentage
change in potato mass should become less positive and then more negative.
| Variable role | Operational choice |
|---|---|
| Independent variable | sucrose concentration; for example, 0.00, 0.20, 0.40, 0.60 and 0.80 mol dm^-3 |
| Dependent variable | percentage change in potato mass, calculated from starting and final masses measured in g |
| Controlled variables | potato-cylinder length and diameter, source potato, volume of solution, immersion time, temperature and blotting method |
You need prepared sucrose solutions, labelled boiling tubes or small beakers, a measuring
cylinder, potato, a cork borer, ruler, scalpel and white tile, a balance, forceps, paper towel
and a timer.
- Prepare three replicate tubes for each sucrose concentration. Label each tube and add the
same measured volume, such as 20 cm^3, of its assigned solution. - Use the same cork borer to cut potato cylinders of equal diameter from one potato. On a
white tile, trim each to the same measured length. Keep fingers away from the cutting
direction; a teacher should provide pre-cut pieces if learners are not trained to use the
sharp tools. - Gently blot each cylinder in the same way, then record its starting mass in g using the
same balance and resolution. - Put one cylinder into each tube, check that it is completely submerged, and leave all
cylinders for the same fixed time, such as 30 minutes, at the same temperature. - Remove each cylinder with forceps. Blot it gently using the same method and immediately
record its final mass. - Calculate the signed percentage change in mass for every cylinder. For each sucrose
concentration, inspect any unusual value, check for a method or recording problem and
repeat that concentration if needed. Calculate a mean from the results that remain after
any exclusion has been justified. - Plot sucrose concentration on the x-axis and mean percentage change in mass on the y-axis.
Equal length and diameter keep the surface area and volume of tissue comparable.
Using one source potato reduces biological variation between pieces. Equal solution volume,
time and temperature isolate sucrose concentration as the intended cause of any systematic
difference. Consistent blotting removes liquid clinging to the outside, which would otherwise
be weighed as if it had entered the tissue.
Replicates show the spread of results and make an anomalous value easier to identify; a mean
reduces the influence of random variation. If the zero-change concentration lies between two
widely spaced concentrations, test additional concentrations in that narrower interval. This
targets the uncertainty in the intercept instead of vaguely asking for "better equipment".
1.17 — Calculating percentage gain and loss
Percentage change compares the mass change with the starting mass. This matters because
the same 0.50 g change is a larger proportional change for a small potato cylinder than for a
large one.
Percentage change in mass
A positive result is a percentage gain. A negative result is a percentage loss on a signed
graph; when asked for the size of the percentage loss, report the positive size and label it
as a loss. Both masses must use the same unit before substitution. The final percentage has
the symbol %, not a mass unit such as g.
Worked example: percentage gain
A potato cylinder has an initial mass of 4.80 g and a final mass of 5.28 g. Find its
percentage gain in mass.
- Requested quantity and values: percentage gain; initial mass = 4.80 g and final mass =
5.28 g. Both values are already in g, so no unit conversion is needed. - Change in mass: .
- Substitution: .
- Answer: the potato has a 10.0% gain in mass.
- Sense-check: the final mass is larger than the initial mass, so a positive percentage
and a gain are sensible; net water entered the tissue.
Worked example: percentage loss
A second cylinder has an initial mass of 6.25 g and a final mass of 5.50 g. Find its
percentage loss in mass.
- Requested quantity and values: percentage loss; initial mass = 6.25 g and final mass =
5.50 g. The units already match. - Change in mass: .
- Signed substitution: .
- Answer: the signed percentage change is -12.0%, which is a 12.0% loss in mass.
- Sense-check: the final mass is smaller, so the negative signed change and the stated
loss agree; net water left the tissue.
1.16–1.17 — From results to a conclusion
The following values are an illustrative dataset, not a claim about one real potato. The
variables and units come first: sucrose concentration in mol dm^-3 is the independent
variable, and mean percentage change in mass is the dependent variable.
| Sucrose concentration / mol dm^-3 | Mean percentage change in mass / % |
|---|---|
| 0.00 | +11 |
| 0.20 | +4 |
| 0.40 | -2 |
| 0.60 | -9 |
| 0.80 | -15 |
[DIAGRAM: asset_name: 1.15-1.17 - Cell transport and osmosis - diagram 02; asset_slug: edexcel-gcse-biology-1-15-1-17-osmosis-percent-change-graph; recommended_method: matplotlib; description: Plot exactly the original illustrative table in this part as five points on a clean scatter graph: x-axis Sucrose concentration / mol dm^-3 from 0.00 to 0.80 and y-axis Mean percentage change in mass / % spanning at least -16 to +12. Add an appropriate straight line of best fit and a thin horizontal reference at y = 0 so the x-intercept can be estimated at about 0.33 mol dm^-3. Use white background, #6A6B6E axes/text/points/line and minimal neutral styling; include no error bars, no copied Pearson data, no claim that these are observed experimental results and no decorative elements.]
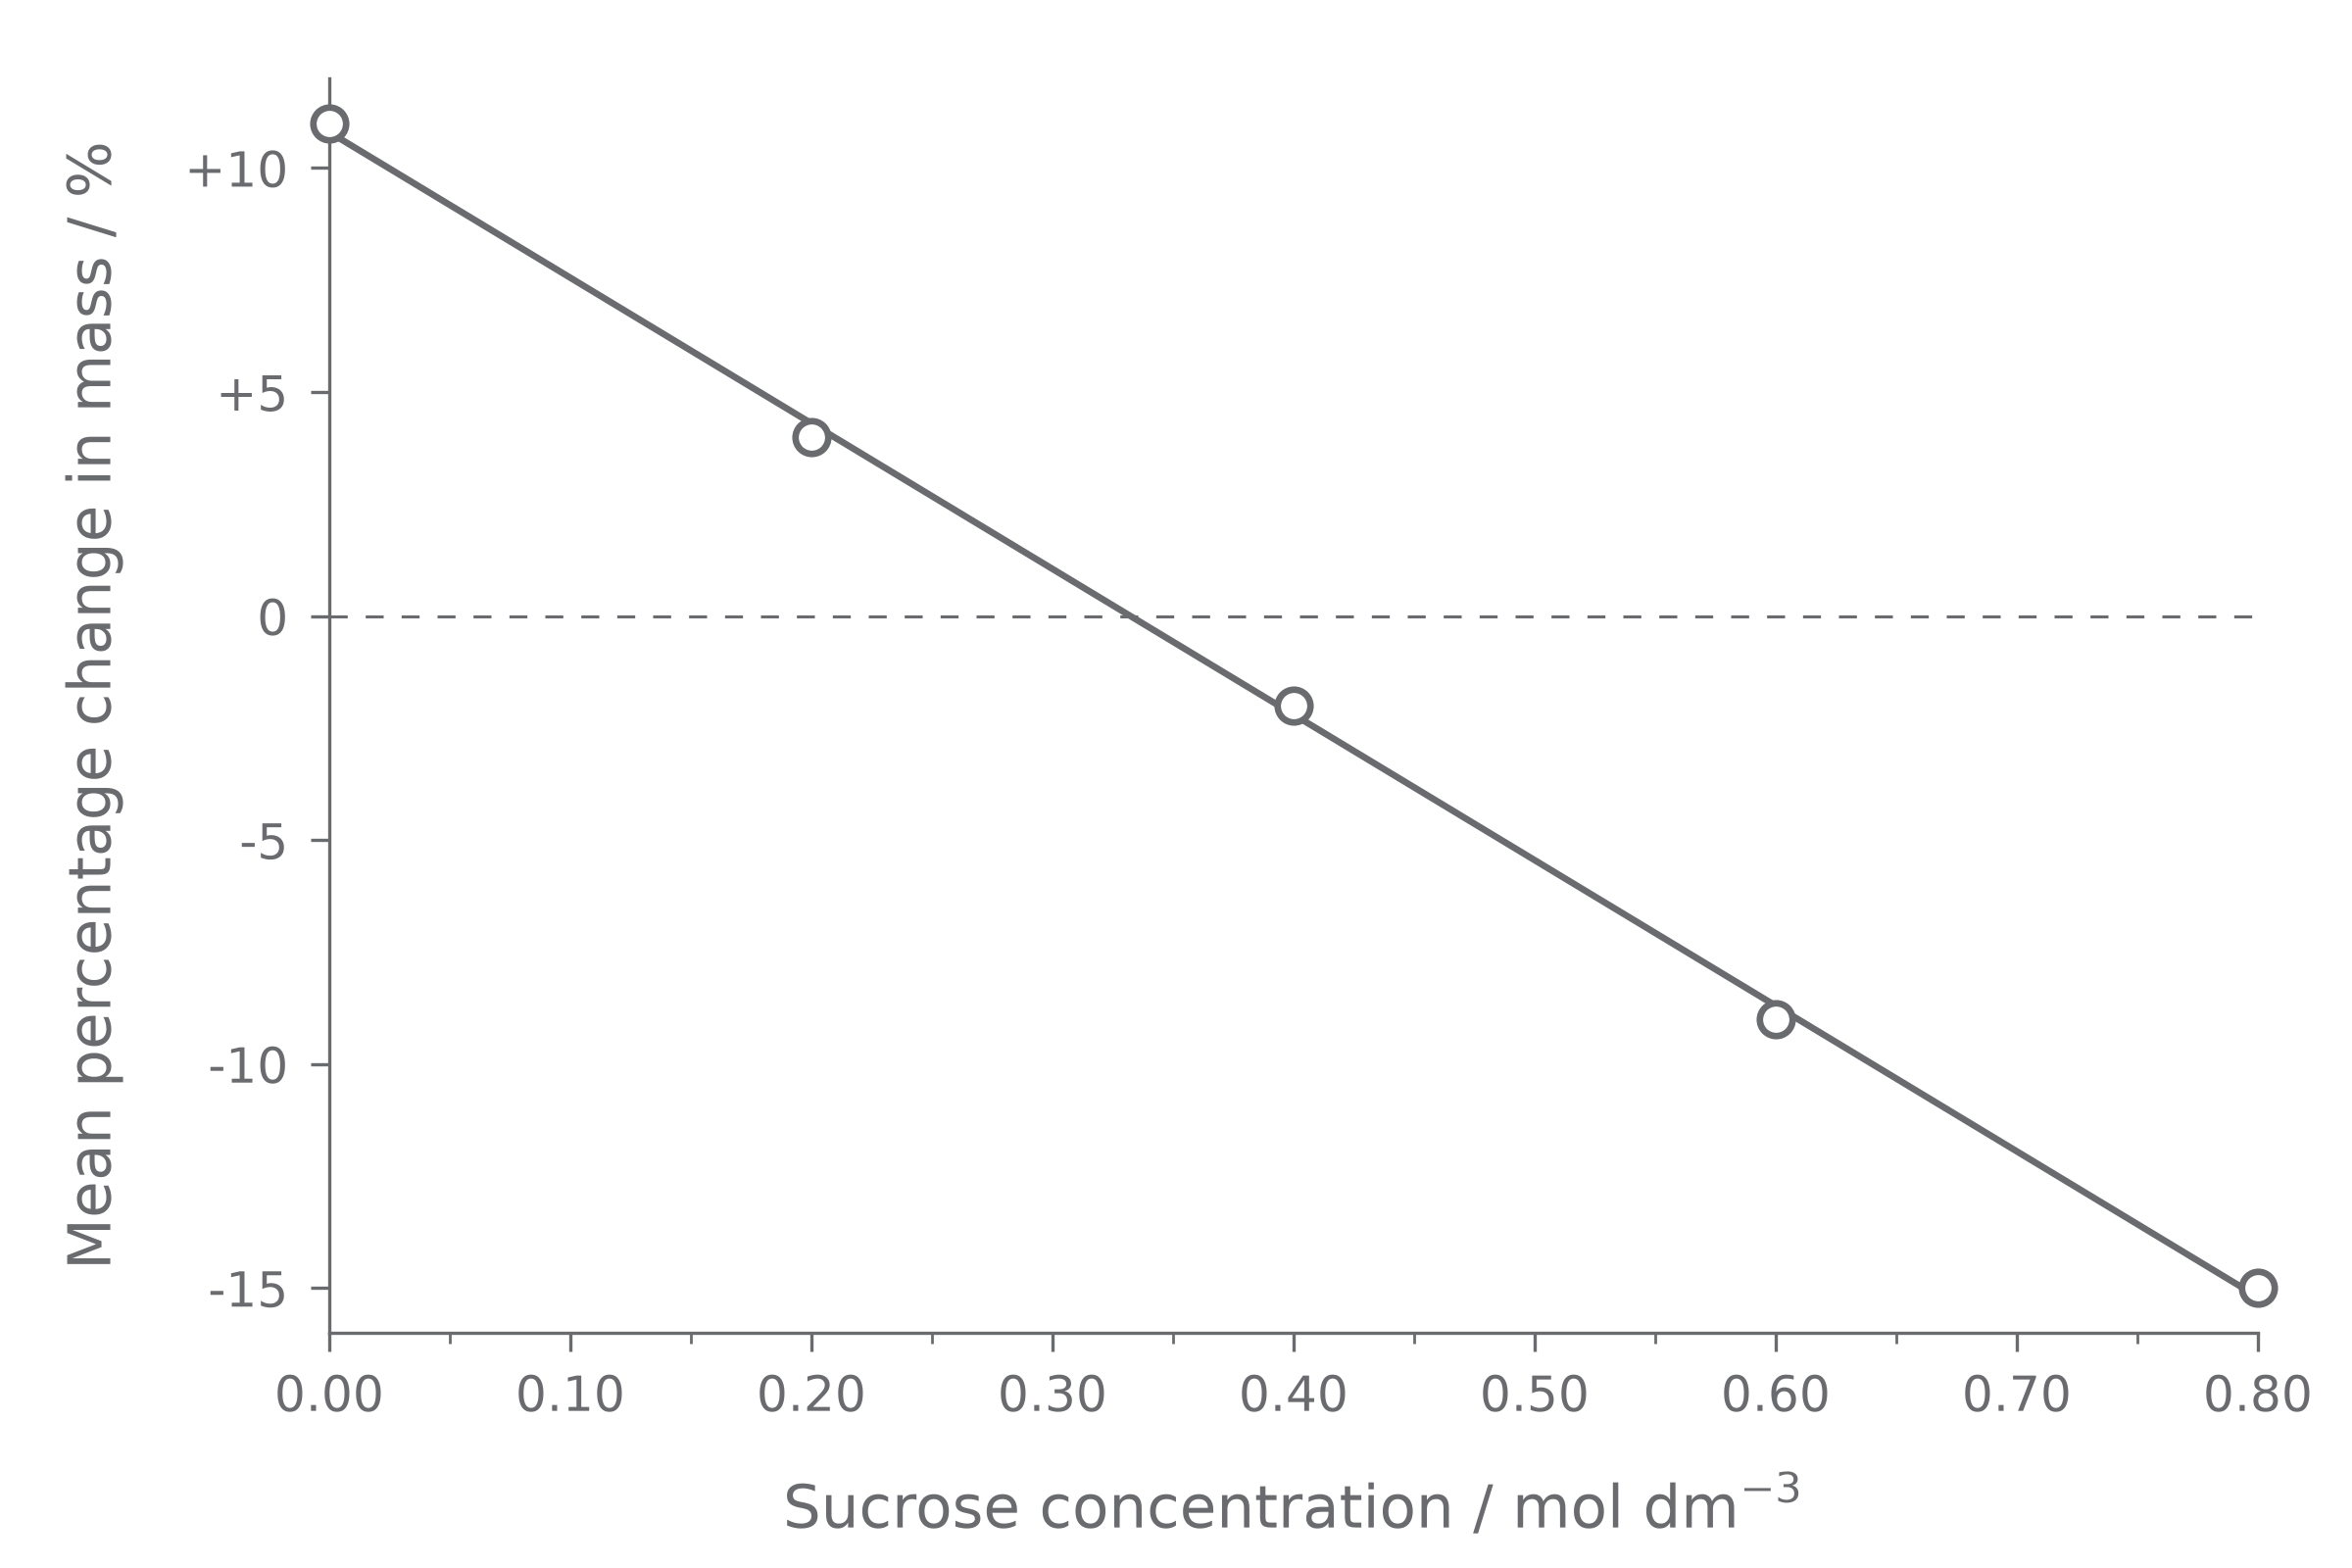
A complete description uses both variables and quantitative evidence: as sucrose
concentration increases from 0.00 to 0.80 mol dm^-3, mean percentage change in mass falls
from +11% to -15%. The positive values at 0.00 and 0.20 mol dm^-3 show net water entry
and mass gain. The negative values from 0.40 mol dm^-3 show net water loss and mass loss.
The line of best fit crosses 0% change between 0.20 and 0.40 mol dm^-3, at about
0.33 mol dm^-3. This is the estimated sucrose concentration that is isotonic to the potato
tissue: it has the same osmotic effect as the cell contents, so there is no net movement of
water and no expected mass change. The estimate is not evidence that water stopped moving
or that sucrose moved through the membranes.
The pattern supports the osmosis mechanism because increasing external sucrose
concentration lowers external water concentration, changing net water movement from into
the potato to out of it. Real repeats will not usually lie exactly on a line. Inspect spread
and anomalies, use mean percentage changes, and add more closely spaced sucrose
concentrations around the zero crossing if the aim is a more precise isotonic estimate.
Positive percentage change means net water entry, negative percentage change means net
water loss, and the x-intercept estimates the concentration at which there is no net water
movement.