2.2.2 - Trade patterns and economic development
Learn how the composition and destinations of trade differ between economies, and use charts and data to explain those patterns without treating every country alike.
Composition and destinations of trade
A country's trade pattern describes what it imports and exports, who it trades with, and how those flows change over time.
Developed economies often export high-value manufactured goods and services, supported by skilled labour, capital, technology and established infrastructure. They may import raw materials, food, energy and manufactured goods. Trade between developed economies is substantial: similar-income countries exchange different varieties and specialised products, rather than only exchanging manufacturing for raw materials.
Some developing economies rely heavily on primary exports such as crops, minerals or fuels and import manufactured goods and capital equipment. Natural-resource availability and limited processing capacity can help explain this. However, developing economies are diverse: many export manufactured goods and services, and some are important parts of international production chains. Developed economies can also be major primary exporters. A development label does not determine every country's trade.
Destinations reflect demand as well as supply. Large or high-income markets can buy more products; nearby partners may have lower transport costs; historical business links and trading agreements can encourage trade. A country can import components from one partner and export assembled goods to another. “Developing countries trade only with developed countries” is therefore an unsafe generalisation.
Reading trade-composition charts
A composition chart compares shares, so read the denominator and categories before drawing conclusions about values.
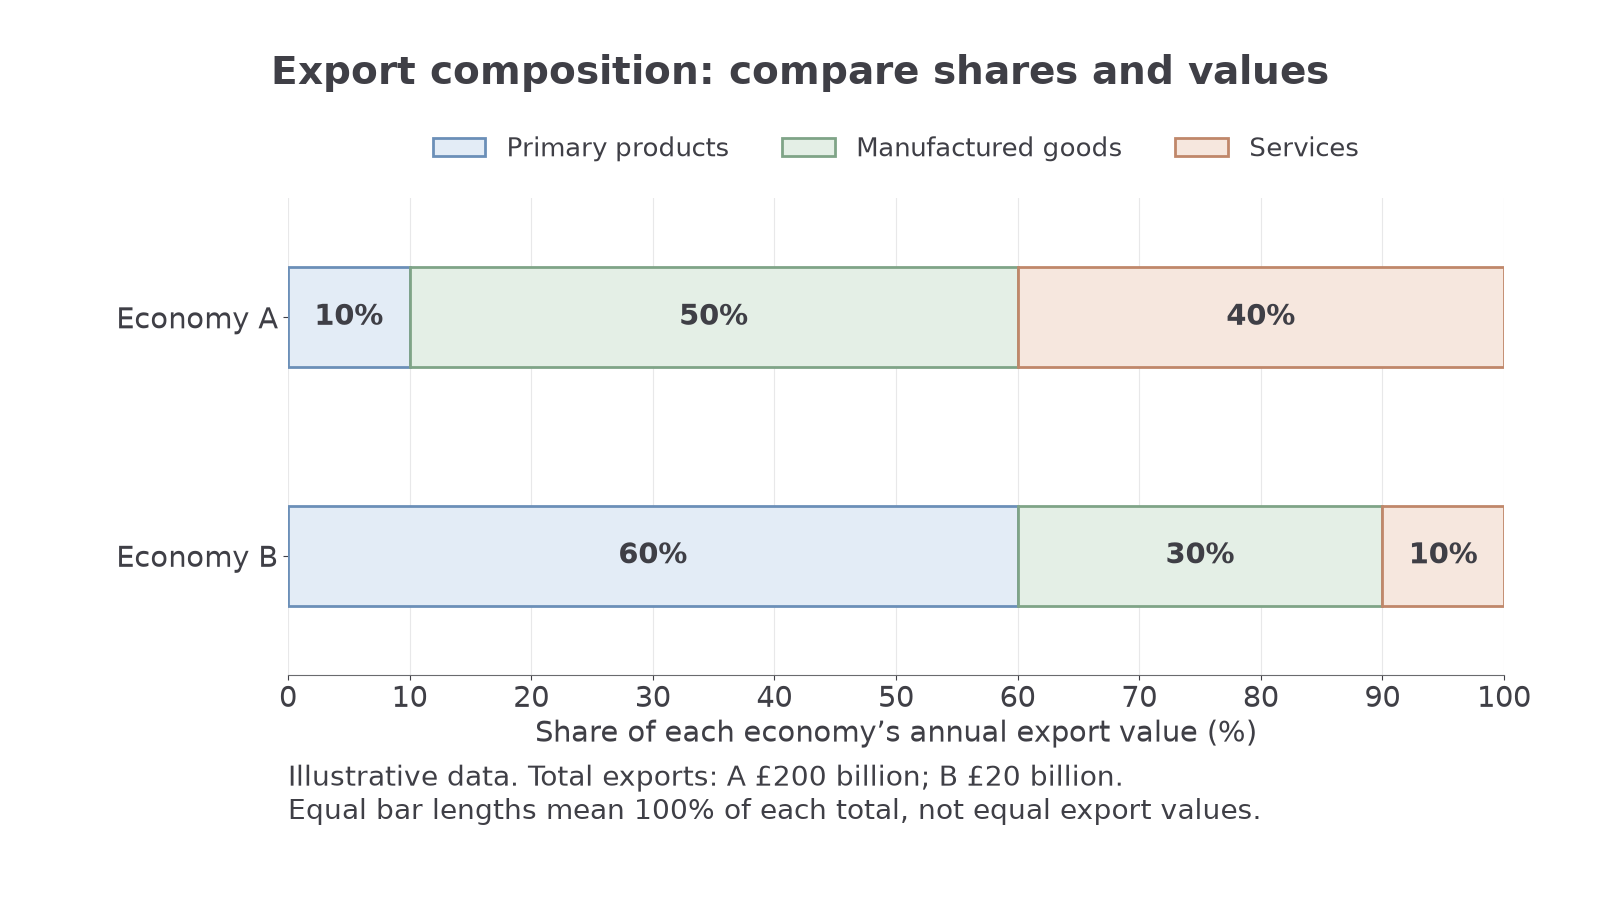
The following export shares are illustrative, not statistics for real countries. Each economy's categories total 100% of its own annual export value. Goods and services are separate here, and “manufactures” excludes primary products.
| Export category | Economy A | Economy B |
|---|---|---|
| Primary products | 10% | 60% |
| Manufactured goods | 50% | 30% |
| Services | 40% | 10% |
| Total annual export value | £200 billion | £20 billion |
[DIAGRAM: asset_name: Illustrative export composition; asset_slug: 4ec1_e49_trade_composition; caption: Economy A's exports contain larger manufacturing and service shares, while Economy B relies more on primary products; description: Two stacked bars, each representing 100 per cent of its economy's exports, with 10/50/40 and 60/30/10 category shares.]
Continue this lesson.
You’re previewing NovaLearn without an account. Create a free account to read the rest.
Create free account