1.1.3 - Excess demand, excess supply and price adjustment
Define and calculate shortages and surpluses at a given price, draw their horizontal gaps on a market diagram, and explain how freely adjusting prices can remove them.
Excess demand and quantity totals
Excess demand exists when buyers want more than sellers offer at the same price over the same period.
Excess demand, also called a shortage, is the amount by which quantity demanded exceeds quantity supplied. Both quantities must refer to the same product, price and time. It is not simply a statement that demand is “high”: a large demand can be met by a large supply.
In an illustrative fruit-box market at £4 per box, two buyer groups demand 32 and 48 boxes per week. Their total demand is 32 + 48 = 80. Two suppliers offer 18 and 22 boxes, giving total supply of 18 + 22 = 40. Add quantities measured in the same units before comparing them; do not subtract one buyer group's demand from the whole market's supply.
Excess demand at a given price
Here, excess demand is 80 − 40 = 40 boxes per week. That is the unmet planned quantity, not the equilibrium quantity and not the number of boxes suppliers offer. With only 40 offered, buyers cannot collectively obtain all 80 wanted at £4. Who receives the available boxes may depend on queues or other allocation rules.
Quantities “per week” are flows over a period. A stock is an amount held at a moment. Do not compare weekly demand with a warehouse stock without knowing how much of that stock is offered during the week. The relevant supply is the quantity offered for the same period as demand.
Excess supply and unsold output
Excess supply exists when sellers offer more than buyers want at the same price over the same period.
Excess supply, also called a surplus, is the amount by which quantity supplied exceeds quantity demanded. At £8 per fruit box, suppose suppliers offer a total of 80 boxes per week but buyers want only 40. The surplus is 80 − 40 = 40 boxes per week. The price is above the illustrative equilibrium price of £6.
Excess supply at a given price
Subtract the smaller planned quantity from the larger one, then identify which side is larger. If supply is 80 and demand 40, reporting “excess demand of −40” obscures the situation: it is excess supply of 40. At equilibrium the quantities are equal, so neither shortage nor surplus exists.
Unsold output can accumulate as stock when goods are stored, but some services and perishable goods cannot be held indefinitely. An empty cinema seat cannot be sold after the performance. A weekly surplus is a mismatch between planned flows; it does not automatically state the warehouse's total stock or how many items have accumulated over several weeks. Those require information about actual sales, storage and previous periods.
Drawing shortages and surpluses
A shortage or surplus is a horizontal quantity gap measured at one fixed price, not a vertical distance between the curves.
The supplied diagram uses original demand D and supply S, with equilibrium E at £6 and 60 fruit boxes per week. In the left panel, a horizontal line at £4 meets S at 40 boxes and D at 80 boxes. The horizontal gap from 40 to 80 is excess demand of 40 boxes. In the right panel, the line at £8 meets D at 40 and S at 80, giving excess supply of 40. Neither curve has shifted between panels; only the price at which the quantities are compared differs.
[DIAGRAM: asset_name: Shortage and surplus gaps; asset_slug: 4ec1_e07_disequilibrium; caption: Below equilibrium, demand exceeds supply; above equilibrium, supply exceeds demand. Measure each gap horizontally at one price.; description: Two fruit-box diagrams with unchanged demand and supply crossing at 60 and £6; £4 gives shortage between Qs40 and Qd80, while £8 gives surplus between Qd40 and Qs80.]
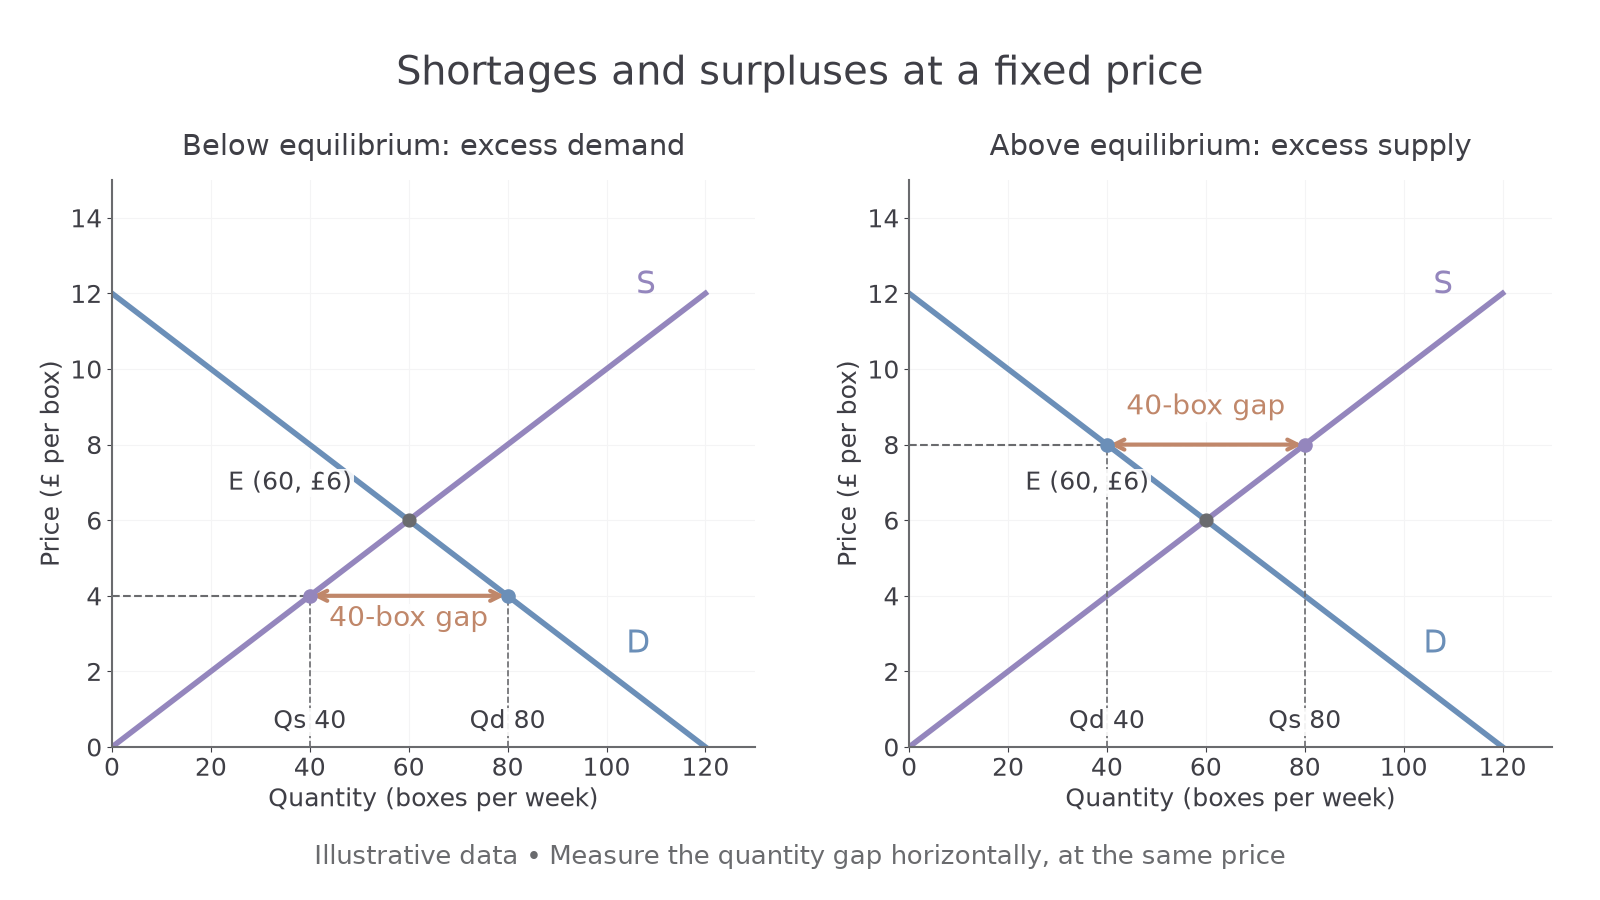
To construct these diagrams from data, use the following illustrative schedules:
| Price per box | Quantity demanded per week | Quantity supplied per week |
|---|---|---|
| £2 | 100 | 20 |
| £4 | 80 | 40 |
| £6 | 60 | 60 |
| £8 | 40 | 80 |
| £10 | 20 | 100 |
Draw labelled price and quantity axes with regular scales. Plot and join the demand points as D and supply points as S. Mark their intersection E. Choose the price to investigate and draw its horizontal line to both curves. Project each intersection down to the quantity axis, label Qd and Qs, and mark the horizontal difference at that price as shortage or surplus. Subtract the quantities to check the labelled size. Do not measure a £ difference and call it a quantity shortage.
Optional notebook construction — ungraded. Draw the schedules yourself, marking excess demand at £4 and excess supply at £8. Compare the axes, curve labels, fixed-price lines, Qd/Qs labels and 40-box gaps with the supplied panels. This teaches the official drawing skill, but the app does not grade an actual drawing submission. A scored text reading of the supplied graph is formative interpretation only.
Market forces and price adjustment
Market forces can remove shortages and surpluses when prices are free to adjust and the underlying demand and supply conditions remain unchanged.
With excess demand, buyers compete for the limited goods available and sellers have an incentive to raise prices. As price rises, quantity demanded contracts along D: some buyers can no longer afford the good or consider alternatives better value. Quantity supplied extends along S because extra sales become more worthwhile. The shortage shrinks from both sides until quantity demanded equals quantity supplied at equilibrium. In the illustrative market, moving from £4 towards £6 reduces demand from 80 towards 60 and increases supply from 40 towards 60.
With excess supply, sellers compete to attract buyers and avoid unsold output, creating pressure to reduce price. As price falls, quantity demanded extends along D, while quantity supplied contracts along S because some output becomes less worthwhile to offer. The surplus shrinks until both reach the equilibrium quantity. Moving from £8 towards £6 raises demand from 40 towards 60 and reduces supply from 80 towards 60.
These are movements along the existing curves. The price adjustment alone does not shift demand or supply. Demand describes the whole price–quantity relationship, while quantity demanded is one point on it; the same distinction applies to supply. Saying “price rises, so demand shifts left” confuses a contraction along D with a change in the relationship.
Adjustment is a mechanism, not a promise that every market clears instantly. Growing crops takes time, suppliers may have short-term capacity limits, and sellers may hesitate to change prices. A rule fixing price below equilibrium can prevent the price rise that would otherwise remove the shortage. If another condition changes during adjustment, the equilibrium itself can change. The stated freely adjusting, otherwise unchanged market is the setting for the diagram's prediction.