1.1.4 - Demand elasticity, determinants and revenue
Learn why consumers respond differently to price changes, calculate total revenue and use the direction of revenue changes to identify elastic or inelastic demand.
Substitutes and necessity
Consumers respond more strongly to a price rise when they can switch easily to an acceptable alternative.
Substitutes are goods or services that can satisfy the same need. If many cafés nearby sell similar lunches, one café’s price rise may send customers elsewhere. Demand for that café’s lunch is likely to be more elastic than demand for lunch in general. The closeness, price and accessibility of alternatives matter: a distant restaurant is less useful to a worker with a short break. A narrowly defined product often has more substitutes than a broad product category.
The degree of necessity also matters. A purchase needed for essential daily activity is harder to abandon than an optional treat. A household may keep buying basic food when its price rises but cancel an extra leisure trip. This tends to make necessities less price elastic. It does not mean necessities are perfectly inelastic. Households can change brands, reduce waste, substitute ingredients or reduce consumption when budgets are tight. A luxury can also have inelastic demand among committed buyers with few close alternatives.
These factors interact. An essential journey may have inelastic demand overall, but one taxi company can face elastic demand if buses and rival taxis offer close substitutes. Always identify the precise market whose elasticity is being discussed.
Budget share and time
A price change receives more attention when it makes a large difference to a household’s spending.
The percentage of income spent on a product affects PED. A 10% price rise on a low-cost pencil adds little to total spending, so a buyer may not change purchases. A 10% rise in the cost of a costly holiday can absorb a substantial share of income and encourage a search for alternatives or cancellation. This is a tendency, not a rule based only on the good’s price: the same purchase represents a larger income share for a poorer household.
Time gives consumers opportunities to adjust. Immediately after a fuel price rise, a driver may still need to commute in the same car. Over months, they can organise shared journeys or use public transport; over years, they can replace the vehicle or move closer to work. Demand can become more elastic as alternatives become practical. Long-run adjustment does not guarantee unlimited substitution: a rural household may still lack a viable alternative.
Do not confuse these determinants with movements along demand. The price change triggers a movement; substitutes, necessity, budget share and time help explain the size of that movement. An estimated PED is specific to the market, consumers and time period studied.
Revenue and price changes
Total revenue depends on both the price received for each unit and the number of units sold.
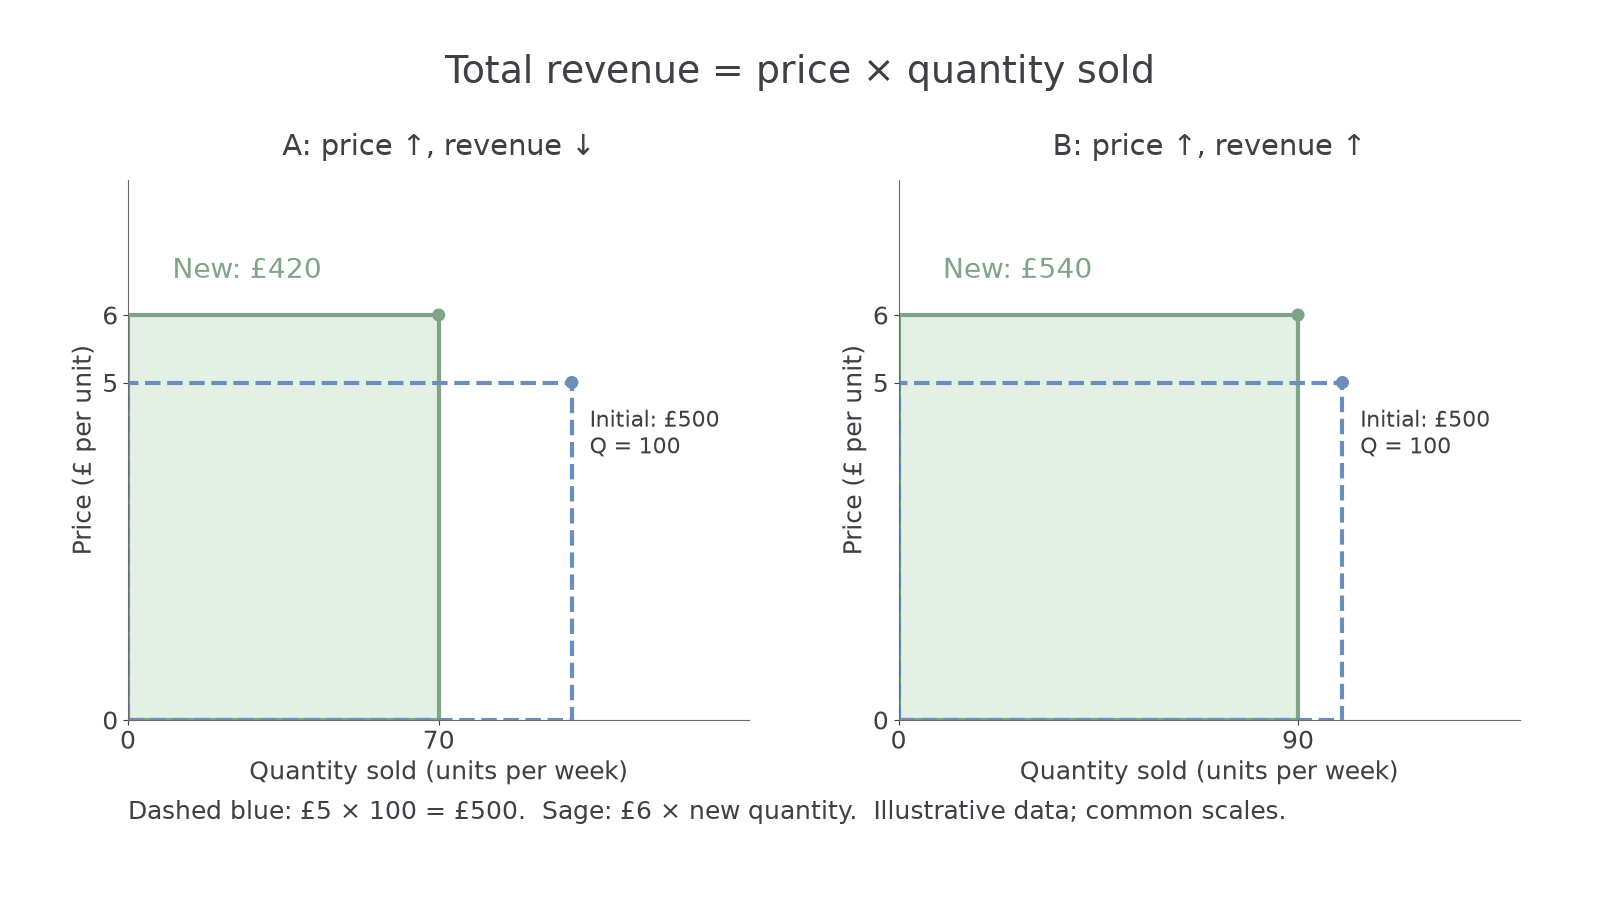
Revenue is sales income before costs are deducted; it is not profit. On a price–quantity diagram, the rectangle from the origin to a sales point has area price × quantity.
Illustrative data: both markets below initially sell 100 units at £5, so revenue is £500. After price rises to £6, market A sells 70 units and market B sells 90 units.
| Market | Initial revenue | New revenue | Change |
|---|---|---|---|
| A | £5 × 100 = £500 | £6 × 70 = £420 | −£80, or −16% |
| B | £5 × 100 = £500 | £6 × 90 = £540 | +£40, or +8% |
In A, losing sales outweighs receiving more per remaining sale: the price rise lowers revenue, indicating elastic demand over the range using the revenue test. In B, the extra revenue per sale outweighs lost sales: price and revenue rise together, indicating inelastic demand by that test. The graph makes the competing effects visible, rather than treating higher price as automatically higher revenue.
[DIAGRAM: asset_name: Revenue rectangles; asset_slug: 4ec1_e09_revenue; caption: A price increase can shrink or enlarge the sales-revenue rectangle; description: Two same-scale panels with initial price 5 quantity 100 and new price 6 quantities 70 and 90, and labelled revenues.]
For a price cut, the directions reverse: elastic demand tends to increase revenue because additional purchases outweigh the lower price; inelastic demand tends to reduce revenue. With unit elasticity in a constant-expenditure relationship, revenue is unchanged. This comparison assumes other influences on demand remain constant. Revenue rising after a price rise does not prove inelastic demand if rising incomes shifted demand at the same time.
The revenue test classifies responsiveness over a price range. For sizeable changes, an original-base percentage PED and a revenue comparison can differ near the unit boundary because the percentage bases differ. Keep the method clear; do not pretend a finite 10% rise and 10% fall cancel exactly: 1.10 × 0.90 = 0.99. For small changes the familiar elastic/inelastic revenue rule and local PED classification agree.
Inferring elasticity from sales
Sales evidence is most useful when it isolates the price change and identifies the relevant period.
Suppose an illustrative museum cuts admission from £10 to £9 and monthly visits rise from 2,000 to 2,400. Revenue rises from £20,000 to £21,600. Price fell while revenue rose, supporting an elastic response over that range. Original-base PED is +20% ÷ −10% = −2, which also indicates elasticity. The manager should still ask whether the month contained a new exhibition, a school holiday or a marketing campaign; those could independently increase demand.
Businesses can run limited trials and compare otherwise similar periods. They need to estimate the relevant market’s response rather than transfer another firm’s PED mechanically. Consumers may initially try a cheaper offer and later return to an earlier supplier, so a short trial may not reveal the lasting response.
Revenue calculations guide pricing, but a revenue increase does not guarantee a profit increase. Serving more customers may increase costs, and revenue figures alone do not show that cost. A revenue claim should therefore stop at what the data establishes.