1.1.3 - Supply and changes in supply
Learn what supply means, construct and read a supply curve, and explain how production costs, technology, indirect taxes, subsidies and natural factors shift it.
Willing and able sellers
Supply describes the quantities producers are willing and able to offer for sale at different prices during a stated period.
A firm must be both willing to sell and capable of providing the product. A wish to sell a thousand cakes is not effective supply if the bakery has no way to bake them. Market supply adds the quantities offered by all producers at each price. Specify the product, its price and a time period: supplying 100 boxes a day differs from supplying 100 a week.
Supply is an intended relationship between price and quantity offered, not simply the quantity buyers eventually purchase. Unsold products can exist because the quantity supplied at a price exceeds what consumers want. Nor is supply identical to a firm's stock: a warehouse may hold goods that the owner is unwilling to sell at the current price.
Supply movements and construction
A supply curve normally slopes upwards because a higher selling price encourages a greater quantity supplied, other conditions unchanged.
A higher price can make extra production worthwhile when producing additional units is costly. It can also make selling goods rather than retaining them more attractive. A rise in the product's own price causes an extension of quantity supplied, moving up and right along the existing curve. A fall causes a contraction, moving down and left. This does not change what producers would offer at every other price, so the curve itself stays in place.
The illustrative supply schedule below concerns boxes of tomatoes per week:
| Price per box | Quantity supplied per week |
|---|---|
| £4 | 20 |
| £6 | 40 |
| £8 | 60 |
| £10 | 80 |
| £12 | 100 |
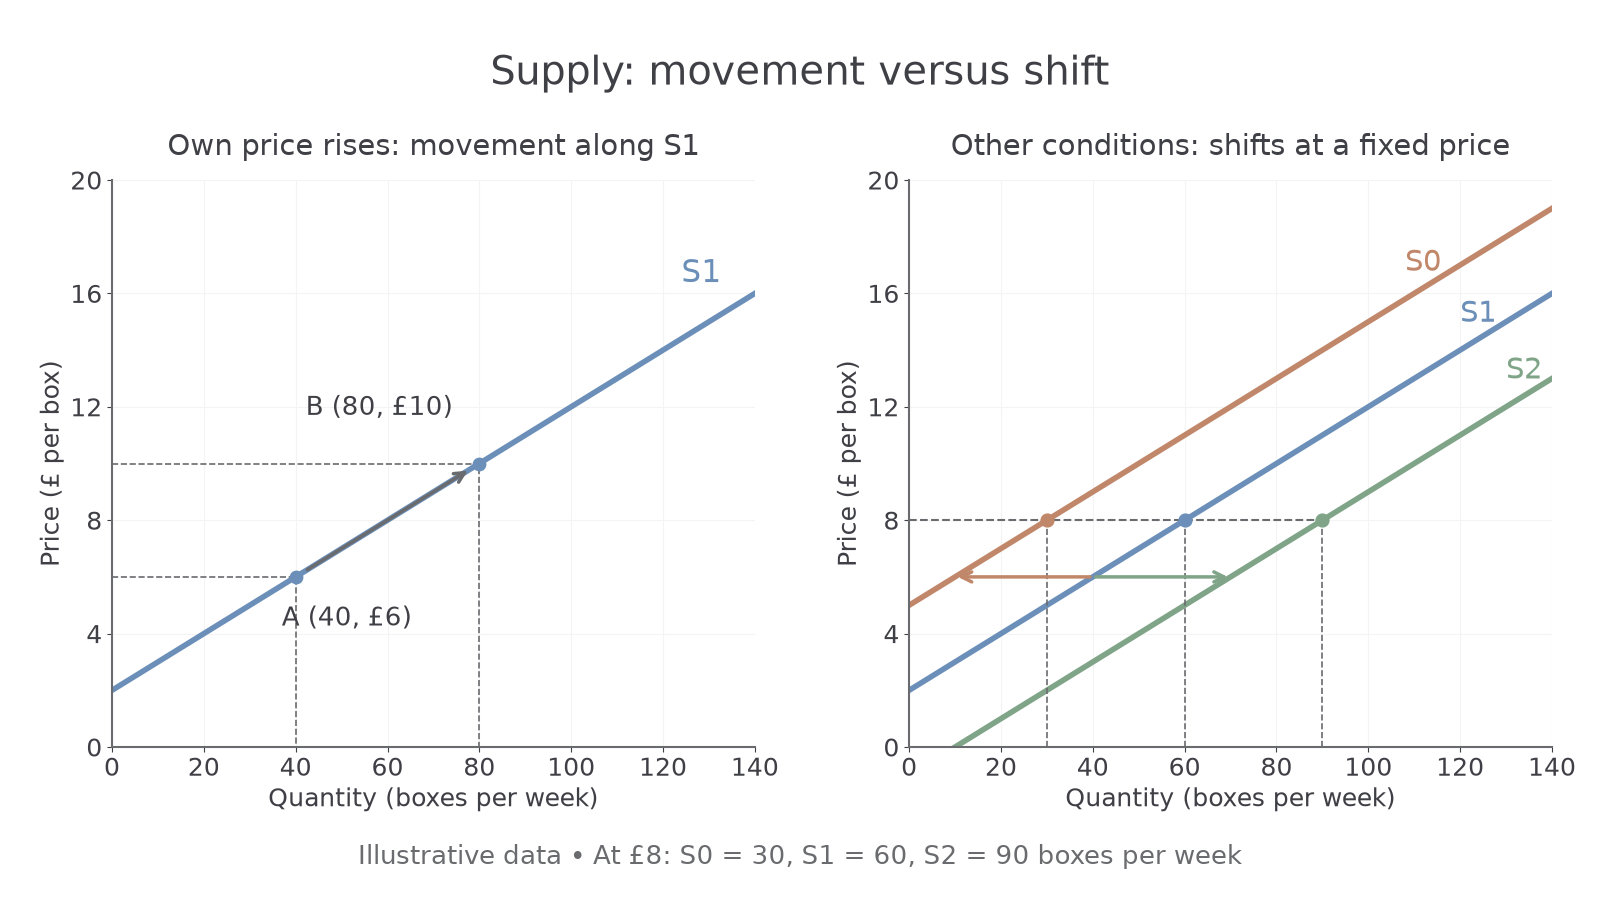
To construct S1, put price (£ per box) on the vertical axis and quantity (boxes per week) on the horizontal axis. Choose regular scales and plot each pair with quantity first: the £6 row is (40,6). Join the points with an upward-sloping line and label it S1. A price rise from £6 to £10 moves from A=(40,6) to B=(80,10), increasing quantity supplied by 40 boxes per week. The same curve represents the whole schedule.
Optional notebook construction — ungraded. Plot the schedule, label S1 and add an arrow from A to B for the price rise. Self-check axes, regular scales, coordinates and an up-right movement against the left panel of the supplied diagram in the next part. A text answer in the app does not establish official drawing performance.
Costs, technology and supply shifts
A change in production conditions alters how much producers will offer at a given selling price and therefore shifts supply.
An increase in supply is a rightward shift: producers offer more at each price. A decrease in supply is a leftward shift: they offer less at each price. At £8, the right panel shows 60 boxes on original S1, 90 on increased-supply S2 and 30 on decreased-supply S0. Compare quantities horizontally at the same price. A rightward supply curve also lies lower: producers can supply a given quantity at a lower price. “Up” is therefore not the right way to describe an increase in supply.
[DIAGRAM: asset_name: Supply movement and shifts; asset_slug: 4ec1_e05_supply; caption: A selling-price change moves along S1; changed production conditions shift supply.; description: Left panel shows A at 40 boxes and £6 moving to B at 80 boxes and £10; right panel shows S0, S1 and S2 with quantities 30, 60 and 90 at £8.]
Costs of production include payments for inputs such as ingredients, energy and labour. If packaging becomes cheaper, producing each tomato box is more attractive at an unchanged selling price. Producers may offer more, shifting supply right. Higher energy or wage costs can make some output no longer worthwhile, shifting supply left. A change in input cost shifts supply; a change in the price of the tomatoes themselves causes a movement along it.
Changes in technology can increase what can be produced from a given amount of resources and reduce unit costs. A more efficient sorting machine may let suppliers prepare more boxes with the same staff time, increasing supply. Technology only shifts supply when it changes productive conditions; merely owning a new computer unrelated to production need not alter output.
To draw a shift, retain S1 and the axes, add a clearly labelled new curve to its right or left, and put an arrow between the curves. For the right panel's illustrated shift, quantities differ by 30 wherever all three curves show non-negative quantities. Real shifts need not be parallel.
Taxes, subsidies and natural factors
Government payments and natural conditions can change supply even when the product's selling price has not changed.
An indirect tax is a tax on spending or production of a good or service. A tax charged per unit sold increases the supplier's cost or reduces what it retains from the selling price. At the same consumer price, some production becomes less worthwhile, decreasing supply and shifting it left. Removing or reducing the tax can have the opposite effect. At this stage the diagram represents the supply change; a later market lesson explains what happens to the equilibrium price.
A subsidy is a government payment supporting production or consumption. A payment to producers per box can lower their effective production cost or increase the return from supplying it. More can be offered at each unchanged selling price, shifting supply right. The effect depends on the payment reaching producers and affecting their incentives or capacity. Do not call a subsidy a rise in consumers' demand when analysing this producer-payment case.
Natural factors include weather and natural disasters. Suitable rainfall and temperatures can raise crop yields, increasing the supply of agricultural goods. Drought, frost or a flood can damage a harvest and reduce supply. A storm may also destroy equipment or interrupt deliveries. Effects depend on the product and location: heavy rain can help one crop but damage another. Explain the link from the particular condition to the available output rather than assuming all natural events move supply the same way.
Several influences can occur together. A subsidy may encourage production while a drought destroys part of a harvest. Their separate directions are clear, but the net supply change depends on their relative size. A change in supply does not itself show how much buyers will purchase; demand is needed to determine the market outcome.