2.1.1 - The economic cycle and effects of growth
Learn to construct and interpret an economic-cycle diagram, connect its stages to growth, inflation and unemployment, and explain the benefits and costs of economic growth.
Constructing the economic cycle
Real output fluctuates over time, so economic growth is rarely a smooth increase every quarter.
The economic cycle describes fluctuations in economic activity through boom, downturn, recession and recovery. A boom is a period of high activity and strong demand; a downturn is a weakening of activity after that high point. A recession is a significant sustained contraction. Two successive quarters of falling real GDP are a commonly used technical indicator, although economists also examine other evidence. Recovery is the renewed expansion after a low point. Stages vary in duration and size; there is no rule that each lasts exactly one year.
Here is an illustrative real-GDP index, with Quarter 1 = 100:
| Quarter | Q1 | Q2 | Q3 | Q4 | Q5 | Q6 | Q7 | Q8 | Q9 |
|---|---|---|---|---|---|---|---|---|---|
| Real-GDP index | 100 | 103 | 106 | 108 | 106 | 103 | 101 | 104 | 107 |
To construct the graph, place quarters in order on the horizontal axis and real-GDP index points on the vertical axis. Choose equal intervals: one quarter horizontally and two index points vertically works here. Label both axes and write the index base. Plot each coordinate, including (Q4, 108) and (Q7, 101), and join successive points. The truncated vertical scale must be clearly labelled; it makes the fluctuations easier to see but does not mean GDP falls to zero.
[DIAGRAM: asset_name: Annotated economic cycle; asset_slug: 4ec1_e32_cycle; caption: Illustrative real GDP contracts after a boom and then recovers; description: Line graph of Q1 to Q9 real-GDP index values 100, 103, 106, 108, 106, 103, 101, 104 and 107, with boom at Q4, downturn at Q5, recession across Q6 and Q7, and recovery across Q8 and Q9.]
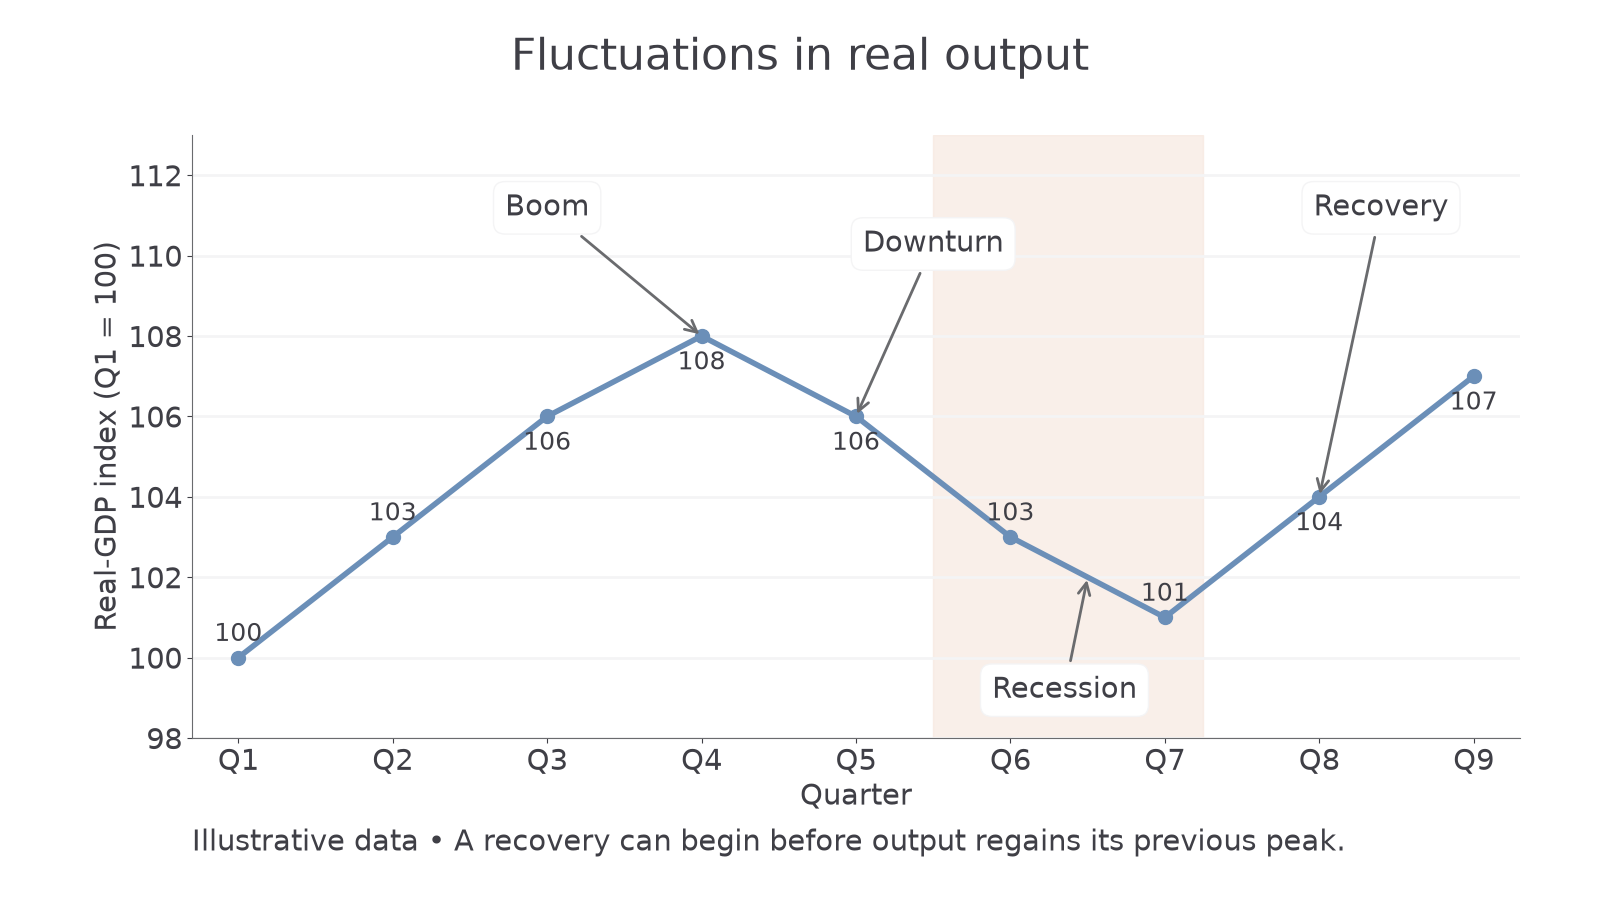
Annotate the high-activity peak at Q4 as boom, Q5 as downturn, the sustained contraction through Q6–Q7 as recession, and the rise through Q8–Q9 as recovery. The falling segments show negative growth; the rising segments show positive growth. Recovery at Q8 does not yet regain Q4's output level. Q9's 107 is also below the earlier peak of 108.
Optional notebook construction — ungraded: draw this graph from the table before comparing it with the supplied image. Check all nine points, even quarter spacing, labelled axes/base and the four stage annotations. This app exercise does not submit or mark a drawing; a written interpretation cannot demonstrate official diagram-construction performance.
The cycle, prices and jobs
Changing demand affects firms' output decisions and labour needs, while spare capacity influences the pressure on prices.
During a boom, consumers and firms buy more. Businesses increase output, hire workers and use more of their machinery. Real GDP is usually growing and unemployment tends to be low. When firms are close to capacity, they may compete for scarce workers or inputs and increase prices rather than expand output quickly. Inflationary pressure is then more likely.
In a downturn, demand and growth weaken. Firms may first cut overtime, leave vacancies unfilled or delay investment. Growth can slow while remaining positive; a downturn does not automatically mean falling GDP. In our graph, output actually falls at Q5, so growth is negative there. Weaker demand usually reduces inflationary pressure, but the price level need not fall.
During a recession, falling sales make some firms cut output and employment. Cyclical unemployment rises, leaving more labour and equipment unused. Lower household incomes can further weaken spending. Inflation often slows because demand is weak. However, an increase in imported energy costs could keep inflation high even during a recession; the cycle is a tendency, not a guarantee about every variable.
During recovery, confidence and spending begin to improve. Firms can initially increase production using spare capacity. Real GDP grows, but hiring may lag if employers wait to see whether demand lasts. Unemployment can therefore remain high early in a recovery. Inflationary pressure may initially be modest and grow as spare capacity is used up.
Look at the output level and its change separately. A growing economy can still be below its previous peak, and low inflation can coexist with prices continuing to rise. Business plans should use evidence about their sector as well as the national stage.
Continue this lesson.
You’re previewing NovaLearn without an account. Create a free account to read the rest.
Create free account