1.1.3 - Demand and changes in demand
Learn what demand means, construct and interpret a demand curve, and distinguish a product's own price change from the six specified influences that can shift its demand.
Willing and able buyers
Demand concerns what consumers are willing and able to buy at different prices over a stated period.
Wanting a product is not enough. A person may want a luxury car but be unable to pay for it. Demand is effective when willingness is backed by the ability to purchase. A demand schedule relates each possible price to the quantity consumers would buy, other relevant conditions unchanged. Demand for a market combines buyers' quantities; it is not just one person's wish.
Always identify the product, price unit and time period. “Demand for 200 boxes” is incomplete unless it tells us at what price and over what period. A weekly demand schedule is not directly comparable with monthly sales. Demand also describes planned purchases at each price, not simply the sales that actually occurred; whether buyers obtain the product depends on supply too.
Price movements and construction
A demand curve normally slopes downwards because a lower price encourages a greater quantity demanded, other conditions unchanged.
At a lower price, more buyers can afford the product and it becomes more attractive relative to alternatives. Existing buyers may also purchase more. This is a movement along the demand curve: the product's own price has changed, while the underlying demand relationship remains the same. A price fall causes an extension of quantity demanded; a price rise causes a contraction of quantity demanded. Calling either a shift confuses the cause with the response.
This illustrative schedule is for boxes of fruit per week:
| Price per box | Quantity demanded per week |
|---|---|
| £5 | 100 |
| £7 | 80 |
| £9 | 60 |
| £11 | 40 |
| £13 | 20 |
To construct the curve, label the vertical axis “Price (£ per box)” and horizontal axis “Quantity (boxes per week)”. Use regular scales and plot quantity as the horizontal coordinate. The £9 row is (60, 9). Join the points with a line labelled D1. A fall from £9 to £7 moves down and right from A=(60,9) to B=(80,7): quantity demanded increases by 20 boxes per week, but the curve stays D1. The reverse movement is a contraction.
Optional notebook construction — ungraded. Plot the five schedule rows, label D1, and draw an arrow from A to B for the price fall. Check the axes, regular scales, point coordinates and down-right arrow against the left panel of the supplied diagram in the next part. This drawing is self-checked on paper, not graded through a text response.
Shifts at every price
A change in something other than the product's own price can alter the quantity buyers want at every given price.
An increase in demand shifts the curve right: more is demanded at the same price. A decrease in demand shifts it left: less is demanded at the same price. In the right panel, at £9 the original D1 gives 60 boxes, the increased-demand D2 gives 90 and the decreased-demand D0 gives 30. Compare horizontally at a fixed price to identify the shift. The price need not have changed to explain it.
[DIAGRAM: asset_name: Demand movement and shifts; asset_slug: 4ec1_e04_demand; caption: A product's price change moves along D1; a change in another demand influence shifts the curve.; description: Left panel shows A at 60 boxes and £9 moving to B at 80 boxes and £7 on D1; right panel compares D0, D1 and D2 at the same £9 price.]
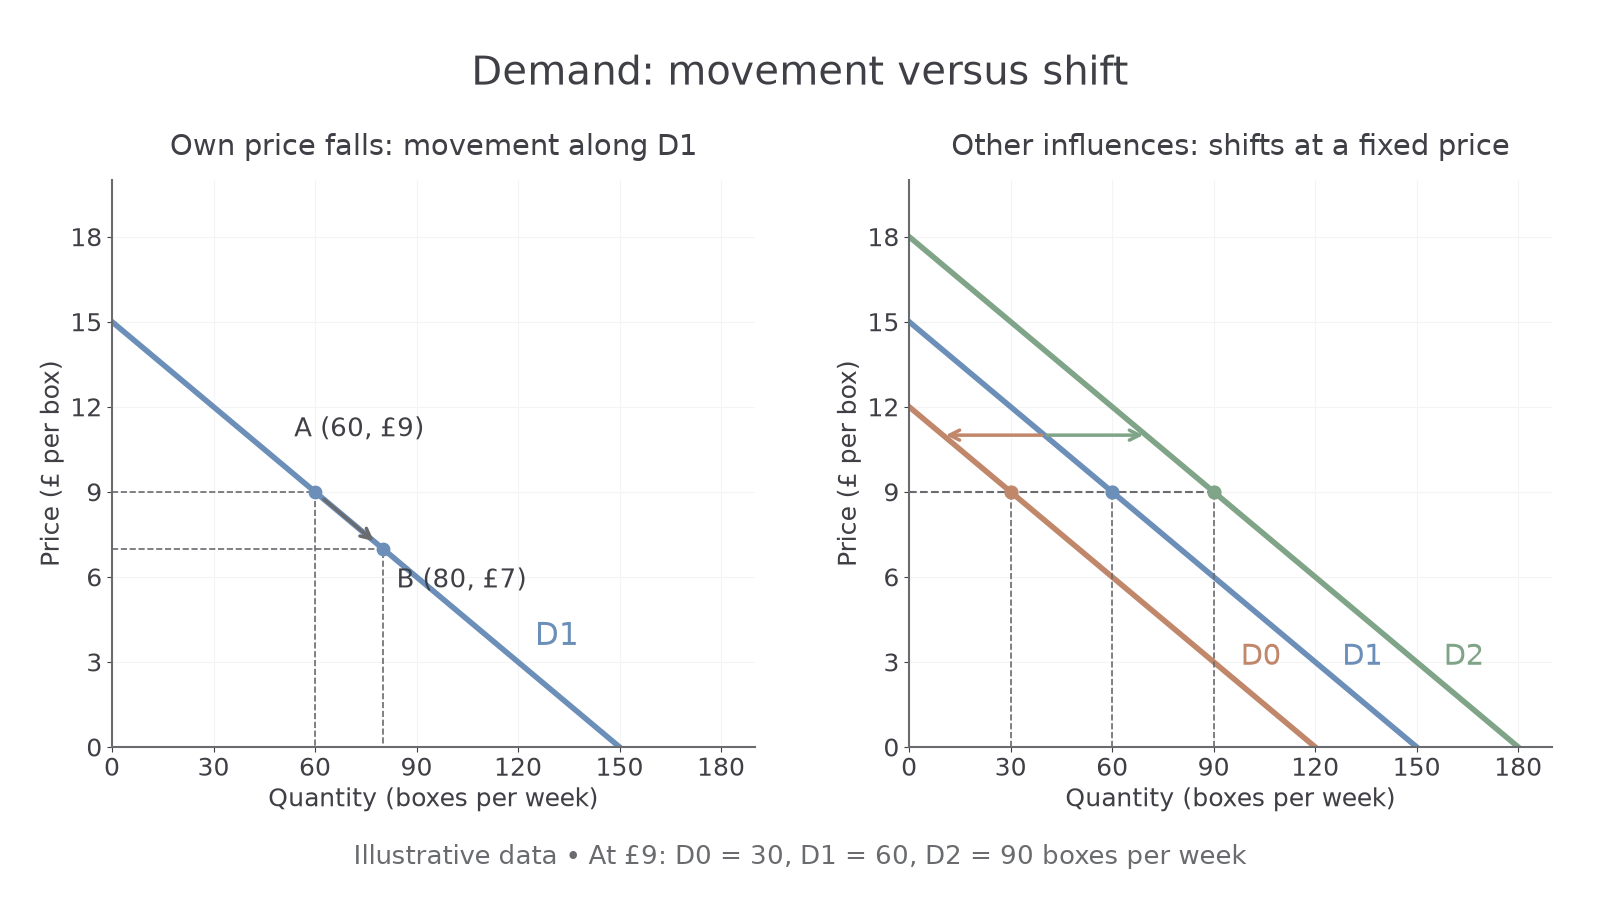
To draw an increase, retain the original axes and D1, then add D2 to its right and label both curves. Use a rightward arrow between them; do not put the shift arrow along D1. To draw a decrease, put D0 to the left. Where all three curves show positive quantities, these illustrative curves are 30 boxes apart at each price. Quantities cannot be negative. The constant difference is a simplification, not a rule that every real shift is parallel.
Separate the cause and the diagram operation: “fruit's own price falls” means a movement; “a successful fruit campaign makes buyers want more at each price” means a shift. When a later market diagram shows price changing after a demand shift, the original cause is still the non-price influence. Do not treat that subsequent price response as a second shift of the same demand curve.
Six demand influences
Demand shifts when buyers' preferences, purchasing power, related alternatives or number change.
Advertising can increase awareness and persuade buyers that a product is useful, raising demand at each price if the campaign succeeds. It may fail if the message is unconvincing or consumers already know the product. Fashion and tastes change what people enjoy: a trend towards cycling can increase bicycle demand, while a trend away from sugary drinks can reduce their demand. A taste change need not result from advertising.
Income affects ability to buy. Higher income usually increases demand for normal goods, such as holidays; a fall usually reduces it. For an inferior good, demand falls as income rises because buyers switch to alternatives they prefer. For example, a consumer might replace a basic budget meal with a preferred meal as income rises. “Inferior” describes this income response, not a judgment that the product must be badly made. Always consider the good's relationship with income rather than assuming every demand curve moves right after an income rise.
The price of a substitute good matters because substitutes can replace one another. If coach journeys and rail journeys are alternatives, a rise in rail fares can increase demand for coach travel at each coach fare. The coach demand curve shifts even though the coach's own price is unchanged. A fall in the substitute's price can reduce demand for the original good.
The price of a complementary good matters because complements are used together. A fall in game-console prices may encourage console purchases and increase demand for compatible games. A rise in the price of printers can reduce demand for ink cartridges. Distinguish the related good's price, which shifts this curve, from this good's own price, which causes a movement.
Demographic changes alter the size or composition of the population. More residents can increase local food demand. An ageing population can raise demand for particular care services, while more young families can raise demand for school places. The effect is product-specific: a change in age structure need not increase demand for every product.