1.1.4 - Elasticity in business and tax decisions
Use price and income elasticities to explain how taxes, subsidies and income changes affect sales, revenue and decisions by businesses and government.
Taxes and demand response
An indirect tax raises the cost of supplying a product, but the resulting fall in purchases depends on consumers’ responsiveness to its price.
An indirect tax is a tax on spending on goods or services. A per-unit tax creates a gap between the price consumers pay and the price producers retain. It shifts supply upward by the tax per unit: producers need a higher buyer price to supply the same quantity after paying the tax. With demand unchanged, the usual result is a higher consumer price and lower equilibrium quantity.
If demand is relatively price inelastic, consumers reduce quantity only slightly when price rises. Businesses can pass on more of a tax through the selling price, other supply conditions being equal. A small quantity fall also preserves a relatively large tax base, helping government raise revenue. Tax revenue is the tax per unit × units taxed, not the whole sales revenue. Inelastic demand can therefore make a tax effective at raising revenue but less effective at reducing consumption.
If demand is relatively elastic, consumers can leave the market or switch products. Passing on the tax causes a greater loss of sales; firms may absorb more through a lower net price. The larger quantity reduction can make a tax effective at discouraging purchases, but may reduce the revenue base. These outcomes depend on supply elasticity too: PED alone cannot determine the exact division of the tax burden.
[DIAGRAM: asset_name: Elasticity and a supply shift; asset_slug: 4ec1_e12_tax_subsidy; caption: The same tax raises buyer price more and reduces quantity less with inelastic demand; description: Same-scale elastic and inelastic demand through a common initial equilibrium, with original supply, a tax shift upward and a subsidy shift downward.]
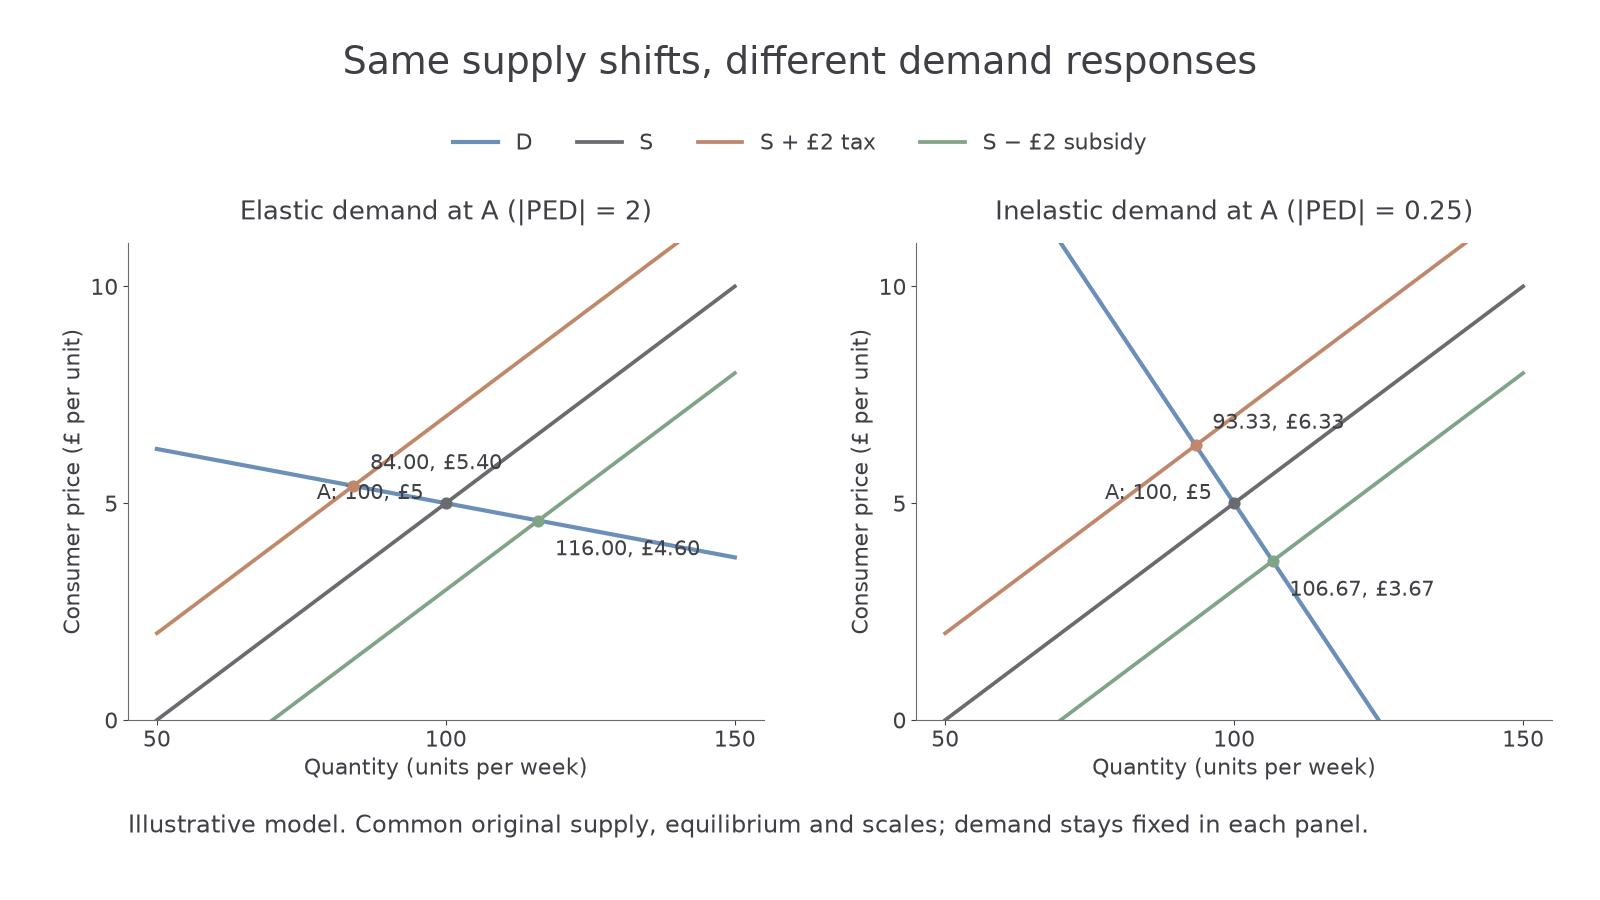
Illustrative graph: both markets initially have price £5 and quantity 100. A £2 unit tax shifts supply up. With elastic demand, buyer price rises to £5.40 and quantity falls to 84; with inelastic demand, buyer price rises to about £6.33 and quantity falls to about 93.33. The tax is £2 in both, but consumers and producers share it differently. The model holds the original supply curve and scales identical.
Subsidies and business planning
A subsidy can lower the consumer price, but it does not ensure that most of the benefit becomes extra consumption.
A subsidy is government financial support that reduces a producer’s effective cost. A per-unit subsidy shifts supply downward: producers can accept a lower consumer price for the same output because government adds a payment. With unchanged demand, equilibrium quantity usually rises and consumer price falls. The graph’s £2 subsidy moves price to £4.60 and quantity to 116 with elastic demand, or approximately £3.67 and 106.67 with inelastic demand.
With elastic demand, a price reduction causes a relatively large increase in purchases, helping a policy aimed at expanding consumption. With inelastic demand, purchases rise less; more support can show up as a lower price for existing customers rather than a large output expansion. Supply constraints can limit expansion further. Government must fund the subsidy, and the bill grows with the subsidised quantity.
For businesses, PED helps estimate whether a subsidy or tax changes sales strongly, how much price adjustment customers will accept and whether capacity or stocks should change. A firm should distinguish sales revenue from the subsidy payment it receives and from profit after costs. Estimates may vary by product, rival and time period, so a coefficient should be used with the stated assumptions rather than treated as a guarantee.
Optional notebook construction — ungraded: copy one graph panel, draw an upward supply shift for a tax and a downward shift for a subsidy, label each new intersection and trace the resulting price and quantity. Check that demand has not shifted merely because the product’s own price changed. Actual drawing is not marked by a text response.
Income changes and sales plans
Income elasticity helps businesses and government anticipate which markets expand or contract when household purchasing power changes.
For normal goods with positive YED, rising income raises demand. A luxury with YED above 1 can experience a more than proportionate increase; a necessity with YED between 0 and 1 tends to grow more slowly. An illustrative leisure firm with YED +2 expects roughly 12% more demand after a 6% income rise, holding prices and other influences constant. It might increase capacity or stocks. If incomes fall instead, the same high responsiveness makes the business vulnerable to a sharp decline.
For an inferior good, negative YED means rising income reduces demand as buyers choose preferred alternatives. A discount seller should not assume that higher household incomes help every product. During an income fall, demand for some lower-cost alternatives may rise while luxury sales fall. Businesses with several product ranges can plan accordingly, but classification may change as consumers or products change.
Government also uses YED to anticipate demand for services and the effects of income changes on taxable spending. Faster growth in luxury purchases can enlarge an indirect-tax base; falling incomes may reduce it. If demand for a subsidised normal service rises with income, keeping the same per-user subsidy can increase total government expenditure. Negative YED for a service can produce the opposite pattern. YED predicts demand, not exact tax receipts or expenditure without the tax/subsidy rate and quantities.
The direction matters as well as the size. PED is normally negative because own price and quantity move oppositely; positive or negative YED distinguishes normal and inferior responses. Government and businesses need both measures when income and product prices change together, and must avoid attributing the whole sales change to either factor alone.