1.2.3 - Diseconomies of scale and long-run average costs
Learn how organisational problems can raise a large firm's average costs, locate its most efficient scale on an LRAC curve, and construct an annotated curve from data.
Organisational diseconomies
Expansion can eventually make a business harder to organise. Diseconomies of scale are increases in long-run average cost as the scale of production increases. A larger total bill alone is insufficient: cost per unit must rise.
Bureaucracy means an increasingly complex system of rules, procedures and approvals. A large factory may need several managers to approve a routine replacement part. Administrative time and delayed repairs raise costs while machinery sits idle. Some procedures improve safety and consistency; the diseconomy occurs when extra administration raises AC.
Communication problems occur when information travels through more departments or layers. A customer's design change may reach production late or inaccurately, causing the wrong components to be made. Rework and wasted materials raise unit costs. Lack of control is different: top managers may struggle to monitor many sites, so poor quality, duplicated work or inefficient use of resources goes unnoticed.
Distance between top management and workers at the bottom of the organisation can reduce understanding and motivation. Decisions made far from the factory floor may ignore practical problems; workers may feel their suggestions are unheard. Lower effort, mistakes or staff turnover reduce output relative to costs. Distance can be organisational as well as geographical. Clear responsibility, shorter communication routes and listening to workers can reduce these problems, so growth does not inevitably cause them at every scale.
Reading the LRAC curve
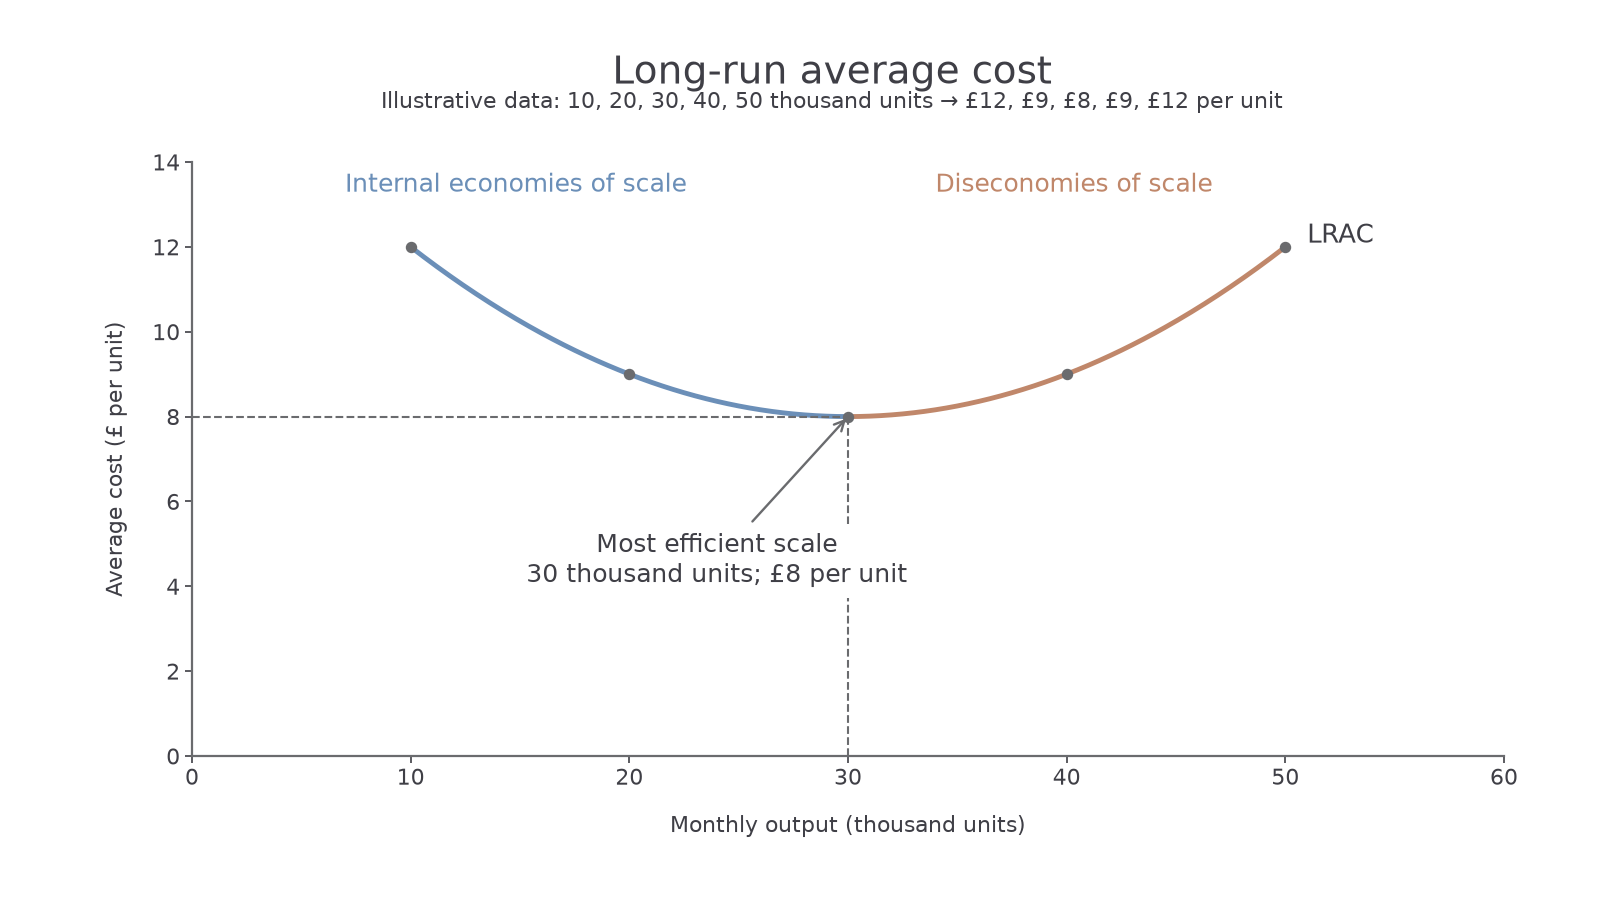
The long-run average cost (LRAC) curve shows the lowest attainable average cost at different scales of output when the firm can vary all its inputs. The long run is a period long enough to change all productive resources; it is not a fixed number of months.
[DIAGRAM: asset_name: Long-run average cost; asset_slug: 4ec1_e21_lrac; caption: Illustrative LRAC falls with internal economies, reaches minimum average cost, then rises with diseconomies; description: Output in thousands of units per month on the horizontal axis and average cost in pounds per unit on the vertical axis. Points are (10,12), (20,9), (30,8), (40,9), (50,12); minimum at 30 thousand units and £8.]
Continue this lesson.
You’re previewing NovaLearn without an account. Create a free account to read the rest.
Create free account