3.1.2(c) - Reaction time and stopping distances
Stopping a vehicle is not one instant. There is a short time while the driver responds, then a separate interval while the brakes reduce the vehicle's speed to zero. In this lesson you will connect reaction time, thinking distance, braking distance and stopping distance, and use those ideas in OCR-style calculations and safety decisions.
The Stopping Timeline
When a driver notices a hazard, the vehicle does not begin braking immediately. The driver has to recognise the hazard, decide to brake, and start applying the brake pedal. During that response interval, the vehicle is still moving forward.
Reaction Time
Reaction time is the time between the driver detecting a hazard and the driver beginning the braking action.
Thinking Distance
Thinking distance is the distance travelled by the vehicle during the driver's reaction time, before braking begins.
Once the brakes are applied, the speed decreases until the vehicle comes to rest. That second distance is not part of the thinking distance.
Braking Distance
Braking distance is the distance travelled from the instant the brakes begin to act until the vehicle stops.
Stopping Distance
Stopping distance is the total distance travelled from the driver detecting the hazard until the vehicle stops.
The relationship is simple but often mishandled:
Stopping Distance
Here, all distances are in metres. The two parts have different causes: thinking distance is mainly a reaction-time effect, while braking distance is mainly a deceleration effect.
[DIAGRAM: asset_name: Lesson 3.01.2c: Reaction Time and Stopping Distances - diagram 01; asset_slug: 3_01_2c_reaction_time_and_stopping_distances__diagram_01; recommended_method: drawn_physics; description: 16:9 NovaLearn-style velocity-time graph for an emergency stop. Axes labelled "time / s" and "velocity / m s^-1". A horizontal section at 24 m s^-1 from 0 to 0.80 s labelled reaction time, then a straight-line decrease to zero by 4.80 s labelled braking. Shade the rectangle under the reaction section as thinking distance and the triangle under the braking section as braking distance. Include labels "hazard seen", "brakes begin", and "vehicle stops".]
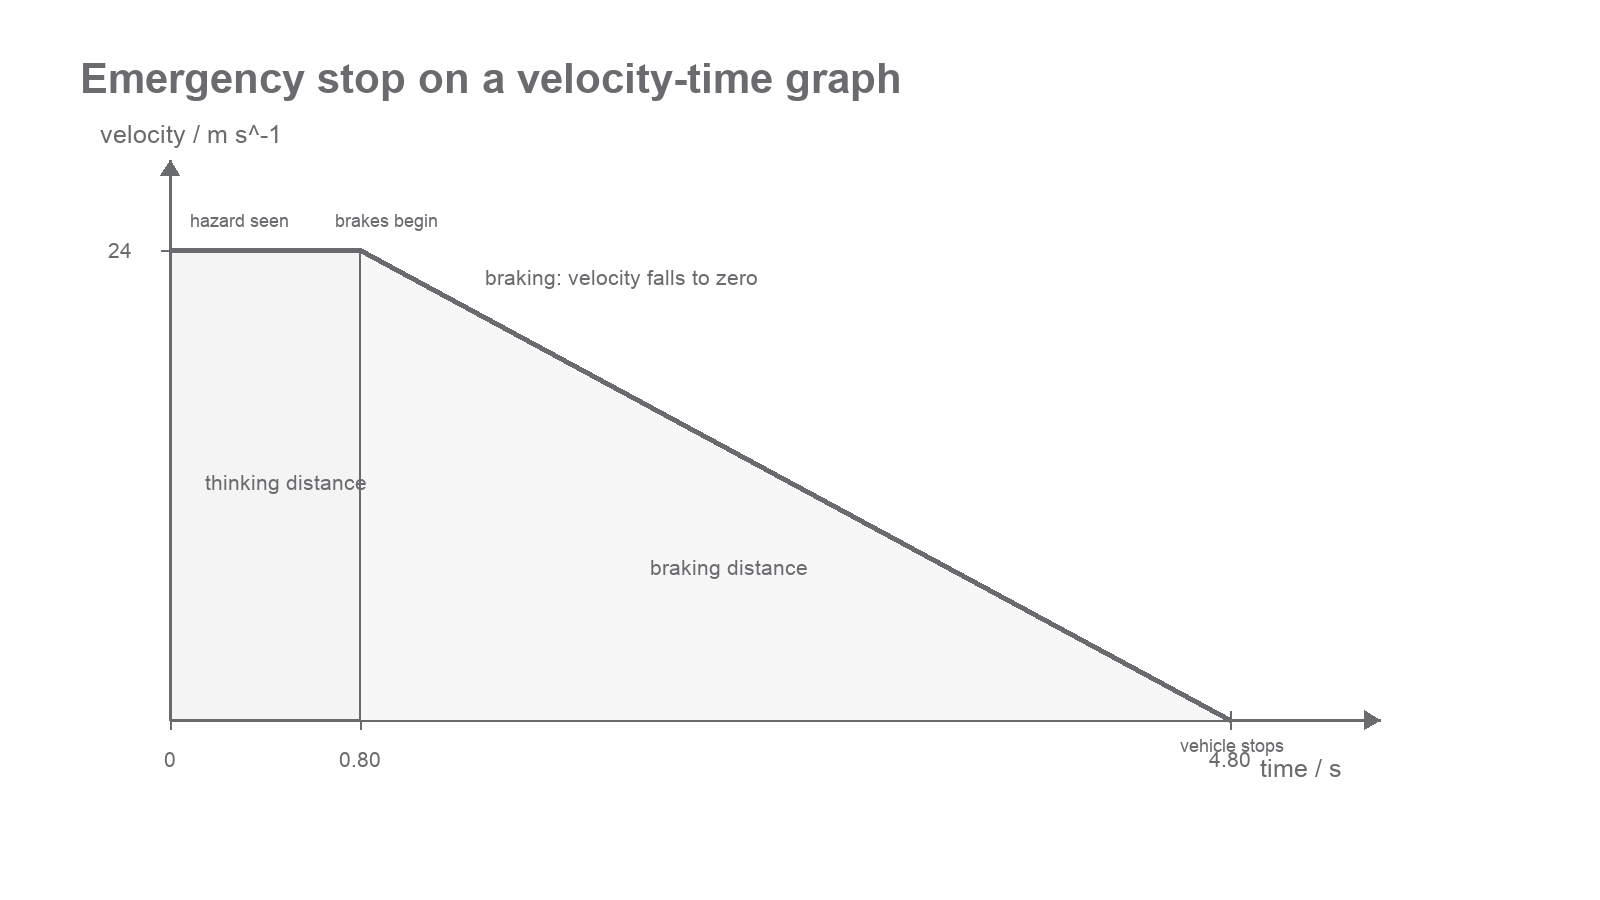
A velocity-time graph makes the split visible. Area under a velocity-time graph is distance travelled. The rectangle during the reaction interval is the thinking distance. The triangular area while the speed falls to zero is the braking distance.
Thinking Distance and Reaction Time
During the reaction time, the usual model is that the vehicle continues at its original speed. That means thinking distance can be calculated using distance = speed x time.
Thinking Distance
Here, u is the vehicle speed during the reaction interval in m s^-1, and t_r is the reaction time in s.
This relationship is directly proportional in two ways:
- if the speed doubles and reaction time stays the same, thinking distance doubles;
- if reaction time doubles and speed stays the same, thinking distance doubles.
Factors that increase reaction time increase thinking distance. Examples include tiredness, alcohol or drugs, distractions, poor visibility, and anything that delays the driver's decision or movement. Speed also increases thinking distance even if the driver is fully alert, because the vehicle covers more metres each second.
Worked example: thinking distance
A car is travelling at 27 m s^-1. The driver's reaction time is 0.70 s.
A sensible answer is:
to two significant figures, matching the given data.
Worked example: converting speed before using it
A question gives a speed of 108 km h^-1. Convert it to m s^-1 before using it in equations.
If the reaction time is 0.80 s, then:
The conversion matters. Using 108 as if it were in m s^-1 would make the answer too large by a factor of 3.6.
Braking Distance and Speed
Braking distance starts only after the brakes begin to act. It depends on how quickly the vehicle loses speed. In many exam calculations the braking acceleration is treated as constant, so you can retrieve the constant-acceleration equation:
Constant-Acceleration Link
For braking to rest, the final velocity is v = 0. The acceleration a is negative if forward is positive. If |a| is the magnitude of the deceleration, then:
Braking Distance For Constant Deceleration
This equation is not a new law of driving. It is the constant-acceleration equation applied to a vehicle slowing from speed u to rest. It is valid when the braking deceleration can reasonably be treated as constant.
Worked example: braking distance from deceleration
A car begins braking at 25 m s^-1 and comes to rest with a constant deceleration of magnitude 6.5 m s^-2.
Use:
Substitute:
So the braking distance is about:
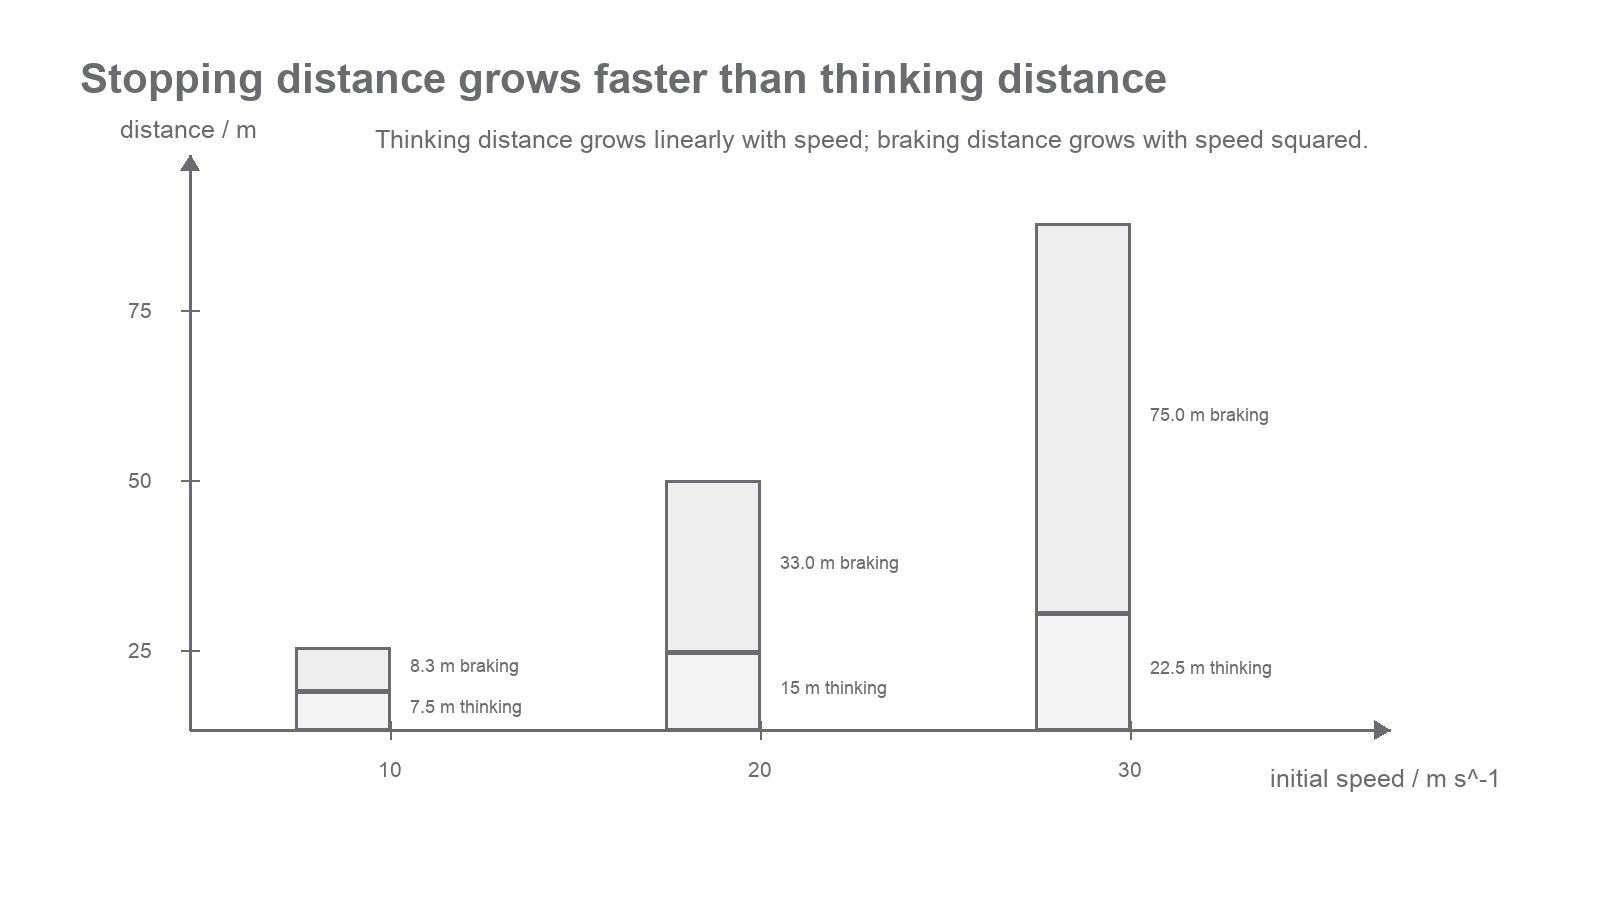
The square on speed is the reason braking distance rises quickly at high speed. If the braking deceleration stays the same, doubling the initial speed makes the braking distance four times larger.
[DIAGRAM: asset_name: Lesson 3.01.2c: Reaction Time and Stopping Distances - diagram 02; asset_slug: 3_01_2c_reaction_time_and_stopping_distances__diagram_02; recommended_method: drawn_physics; description: 16:9 NovaLearn-style grouped stacked bar chart for initial speeds 10, 20 and 30 m s^-1. Use reaction time 0.75 s and braking deceleration magnitude 6.0 m s^-2. Each bar is split into thinking distance and braking distance, with labels showing thinking distances 7.5 m, 15 m, 22.5 m and braking distances about 8.3 m, 33 m, 75 m. Add a note that thinking distance grows linearly with speed while braking distance grows with speed squared for constant deceleration.]
Be careful with explanations. Poor brakes, worn tyres, wet or icy roads, and loose surfaces can reduce the braking force or reduce the braking deceleration, so the braking distance increases. A larger mass does not automatically mean a longer braking distance in every model. If a question states the same braking force, a larger mass gives a smaller deceleration and a longer braking distance. If a question assumes tyre-road friction that scales with normal contact force, mass may cancel in the ideal model. Use the model the question gives.
Stopping Distance Decisions
Stopping-distance questions often ask for a decision: will the vehicle stop before an obstruction, or is a suggested following distance enough? The physics route is:
- Put speed into S.I. units if needed.
- Find the thinking distance.
- Find or use the braking distance.
- Add them to get stopping distance.
- Compare the stopping distance with the available distance.
- State a conclusion that follows from the comparison.
Worked example: will the car stop in time?
A car travels at 30 m s^-1. The driver sees a hazard 95 m ahead. The reaction time is 0.75 s. Once the brakes act, the constant deceleration has magnitude 6.0 m s^-2.
Thinking distance:
Braking distance:
Stopping distance:
The car will not stop before the hazard because 97.5 m is greater than the available 95 m.
The conclusion must use the comparison. A vague answer such as "it is dangerous" is not enough by itself. The evidence is the calculated stopping distance being larger than the available distance.
Velocity-time graphs can support the same calculation. During reaction time, the area is a rectangle. During uniform braking to rest, the area is a triangle:
where t_b is the braking time. This triangular-area method is equivalent to the constant-acceleration equations when the speed decreases linearly.
Worked example: using braking time from a graph description
A vehicle travels at 18 m s^-1. The driver reacts for 0.60 s. The brakes then reduce the speed uniformly to zero in 3.5 s.
Thinking distance:
Braking distance from the triangular area:
Total stopping distance:
So the stopping distance is about 42 m.
Factors, Data and Evaluation
OCR-style stopping-distance questions are often about interpreting data, not memorising a table. If a table gives thinking, braking and stopping distances at different speeds, use the data supplied in the question.
Two patterns are especially common:
- thinking distance increases in direct proportion to speed when reaction time is constant;
- braking distance increases more rapidly because, for constant braking deceleration, it is proportional to speed squared.
That does not mean every real vehicle follows a perfect square law. Brakes heat up, tyres deform, the road surface changes, and drivers do not all apply the brakes in exactly the same way. In exam modelling, state the assumption: constant reaction time for thinking distance, and constant braking deceleration for the square-speed braking model.
Factors affecting thinking distance usually act through reaction time:
| Factor | Main effect |
|---|---|
| greater speed | more distance travelled each second during the same reaction time |
| tiredness | longer reaction time |
| alcohol or drugs | impaired response, often longer reaction time |
| distraction | delayed detection or decision |
| poor visibility | hazard detected later or response delayed |
Factors affecting braking distance usually act through braking deceleration:
| Factor | Main effect |
|---|---|
| greater speed | much larger braking distance for the same deceleration |
| wet or icy road | smaller tyre-road friction, smaller deceleration |
| worn tyres | reduced grip, especially on wet roads |
| worn or overheated brakes | smaller braking force for a given pedal input |
| downhill slope | component of weight acts along the motion, reducing the effective deceleration |
| uphill slope | component of weight acts against the motion, increasing the effective deceleration |
There is no named PAG method to learn for this row, but the practical skills still matter. If a question describes an investigation into reaction time or stopping distance data, think like a physicist:
- identify the independent variable, such as initial speed or road condition;
- identify the dependent variable, such as stopping distance or reaction time;
- control variables such as vehicle, tyres, braking method, surface and driver alertness where possible;
- repeat readings and calculate a mean where reaction-time variation is important;
- use appropriate units and sensible significant figures;
- evaluate whether the conclusion is justified by the scatter, uncertainty and range of data.
Worked example: data claim
A table gives these values:
| Speed / m s^-1 | Thinking distance / m | Braking distance / m |
|---|---|---|
| 10 | 8 | 9 |
| 20 | 16 | 36 |
When speed doubles from 10 m s^-1 to 20 m s^-1, thinking distance doubles from 8 m to 16 m. Braking distance increases from 9 m to 36 m, which is four times larger. The stopping distance increases from:
to:
The stopping distance has more than tripled, because the braking part has increased much faster than the thinking part.
Factors, Data and Evaluation Summary
For stopping-distance decisions, calculate the two parts separately, add them, then compare the total with the distance available.