3.1.1 - Kinematics and motion graphs
Motion is easier to analyse when you can move between words, equations and graphs. In this lesson you will define the main kinematics quantities, interpret displacement-time and velocity-time graphs, and use gradients and areas to extract physical information. These skills are also practical skills: a motion sensor or data-logger only becomes useful when you know what the graph means.
Motion Quantities
Kinematics describes motion without first asking what force caused it. For this lesson, the most important quantities are displacement, speed, velocity and acceleration. They sound familiar, but each has a precise meaning.
Displacement
Displacement is the change in position from a chosen starting point to a final position, in a specified direction. It is a vector quantity, so direction matters.
Distance travelled and displacement are not the same. If a trolley moves 3.0 m east and then 3.0 m west back to its start, the total distance travelled is 6.0 m, but the displacement from the start is 0 m.
Speed and velocity make the same scalar-vector contrast.
Speed
Speed is the rate of change of distance. It is a scalar quantity and is never negative.
Speed tells you how fast distance is being covered, but it does not tell you which way the object is moving.
Velocity
Velocity is the rate of change of displacement. It is a vector quantity, so its sign or direction depends on the chosen positive direction.
Average speed uses total distance travelled:
Average Speed
Average velocity uses displacement:
Average Velocity
The units are important. Distance and displacement are measured in metres, m. Speed and velocity are measured in metres per second, m s^-1.
Worked example: average speed and average velocity
A student walks 12 m east in 6.0 s, then 4.0 m west in the next 4.0 s.
Total distance travelled:
Total displacement, taking east as positive:
Total time:
Average speed:
Average velocity:
The plus sign means the average velocity is east, using the sign convention chosen in the question.
Acceleration describes how velocity changes.
Acceleration
Acceleration is the rate of change of velocity. It is a vector quantity with unit m s^-2.
For a time interval where the change in velocity is known:
Acceleration
Here, a is acceleration in m s^-2, \Delta v is the change in velocity in m s^-1, and \Delta t is the time interval in s.
Worked example: acceleration from a change in velocity
A model car's velocity changes from +2.0 m s^-1 to +8.0 m s^-1 in 3.0 s.
The positive acceleration means the velocity is becoming more positive. It does not simply mean "moving to the right" unless the positive direction has been defined that way.
Instantaneous And Average Rates
A rate of change compares how quickly one quantity changes as another quantity changes. In kinematics, the second quantity is usually time.
An average rate is calculated over a whole interval. An instantaneous rate is the rate at one particular instant. This distinction is one of the most important ideas in this lesson.
Instantaneous Speed
Instantaneous speed is the speed of an object at a particular instant. It is the magnitude of the instantaneous velocity.
For example, the reading on a car speedometer is an instantaneous speed. It does not tell you the average speed for the whole journey.
Worked example: average rate from two readings
A trolley has displacement 0.50 m at t = 1.0 s and displacement 2.90 m at t = 4.0 s.
The average velocity between these times is:
This is an average over the 3.0 s interval. The trolley may have been moving slower than this at the start and faster than this at the end.
In graph language, an average rate is the gradient of a chord joining two points. An instantaneous rate is the gradient of a tangent at one point.
[DIAGRAM: asset_name: Lesson 3.01.1: Kinematics Graphs and Rates - diagram 01; asset_slug: 3_01_1_kinematics_graphs_and_rates__diagram_01; recommended_method: drawn_physics; description: 16:9 NovaLearn-style displacement-time graph with axes labelled time t / s and displacement s / m. A curved displacement-time line has two marked points joined by a dashed chord labelled "chord gradient = average velocity". A tangent touches the curve at one point and is labelled "tangent gradient = instantaneous velocity" with a true arrowhead label arrow. White background, #6A6B6E only.]
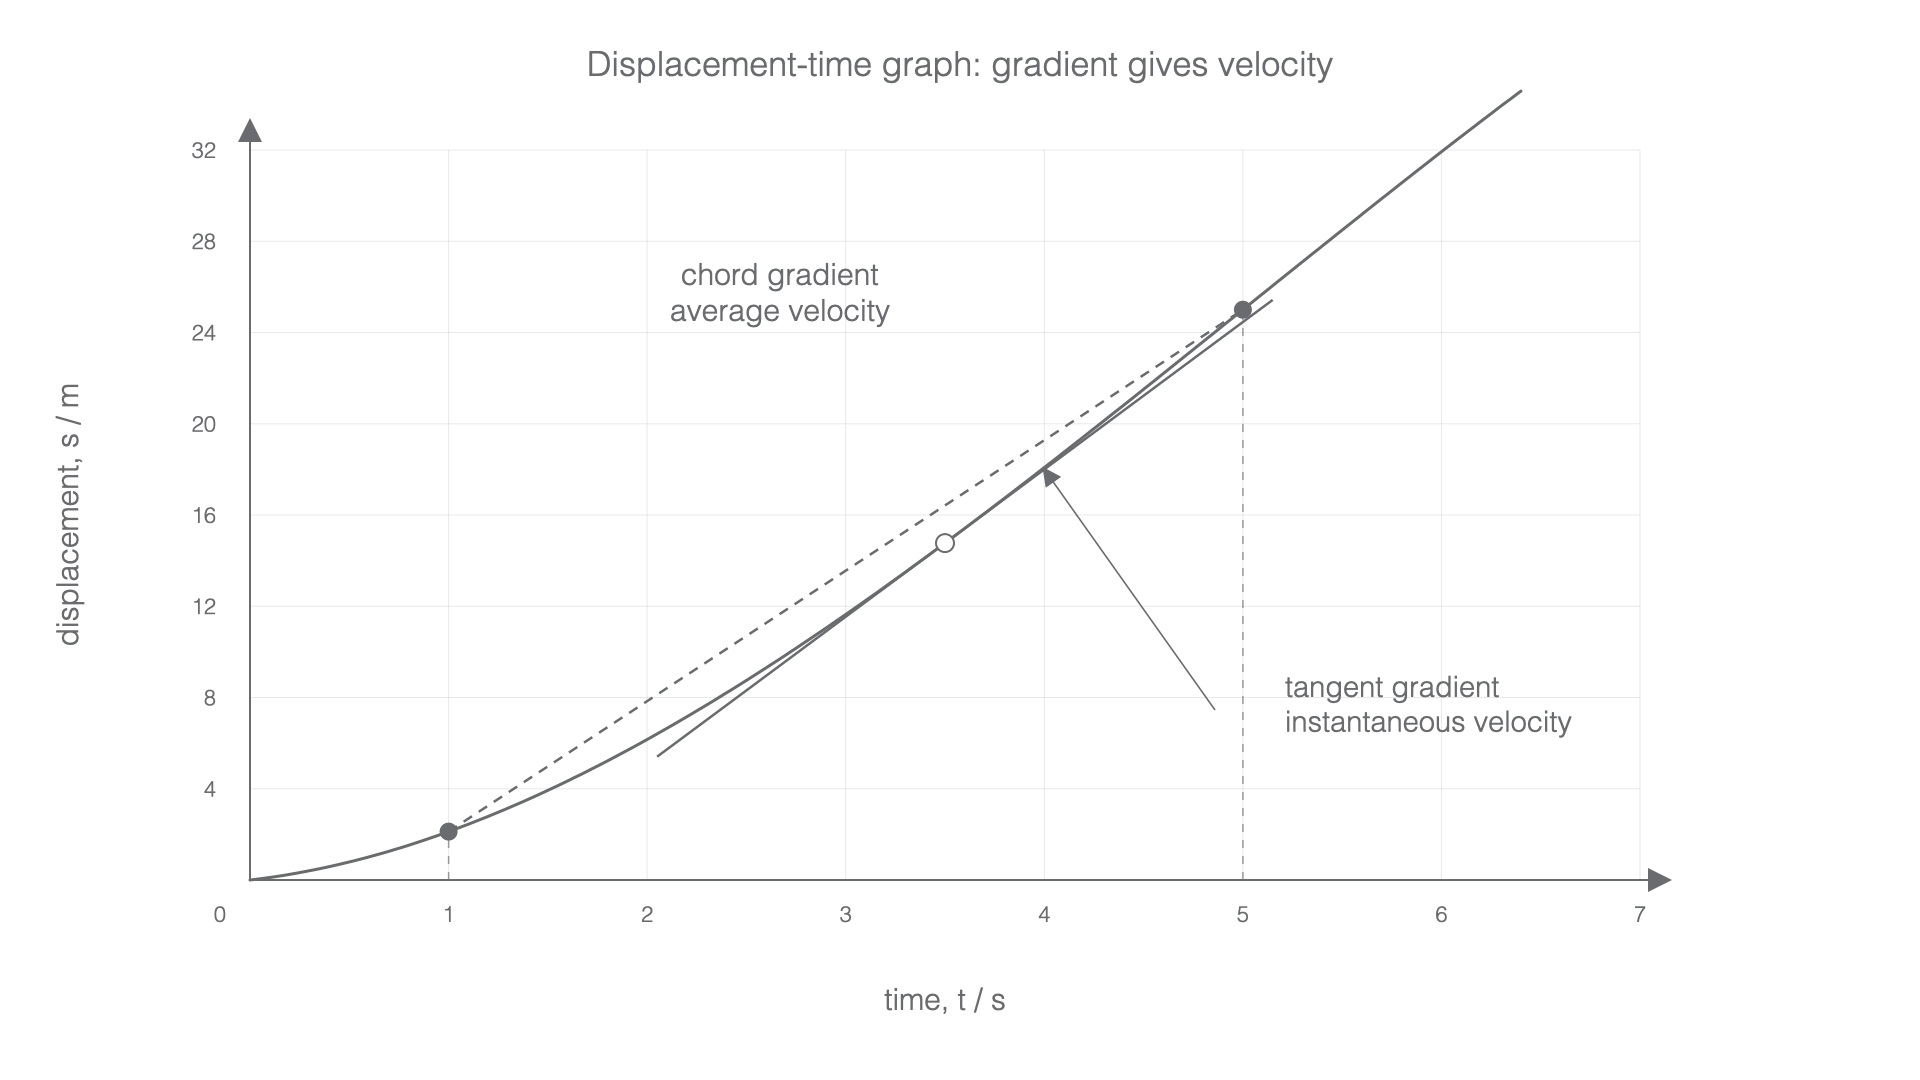
The units reveal the physical meaning of the gradient:
So the gradient of a displacement-time graph has the unit of velocity.
Displacement-Time Graphs
On a displacement-time graph, the vertical axis is displacement and the horizontal axis is time. The graph does not show the path taken through space. It shows how displacement from a chosen origin changes with time.
The gradient gives velocity:
Velocity From A Displacement-Time Graph
For a straight section, the velocity is constant because the gradient is constant. For a curve, the velocity is changing because the gradient changes.
Useful graph meanings:
| Displacement-time feature | Motion meaning |
|---|---|
| horizontal line | zero velocity; displacement is constant |
| straight line with positive gradient | constant positive velocity |
| straight line with negative gradient | constant negative velocity |
| steeper gradient | larger magnitude of velocity |
| curve getting steeper | speed increasing in that direction |
| curve becoming flatter | speed decreasing in that direction |
Worked example: velocity from a straight displacement-time section
A graph shows displacement increasing from 1.0 m to 7.0 m between t = 2.0 s and t = 5.0 s.
Because the section is straight, this is the velocity throughout that section.
Worked example: estimating instantaneous velocity from a tangent
A curved displacement-time graph has a tangent drawn at t = 3.0 s. Two clear points on the tangent are (2.0 s, 1.6 m) and (4.0 s, 5.0 m).
Use the tangent, not nearby raw points from the curve:
The word "approximately" matters because drawing and reading a tangent from a curve involves judgement.
A common error is to say that a curved displacement-time graph means a curved path. It does not. A ball moving in a straight line can have a curved displacement-time graph if its velocity changes.
Velocity-Time Graphs
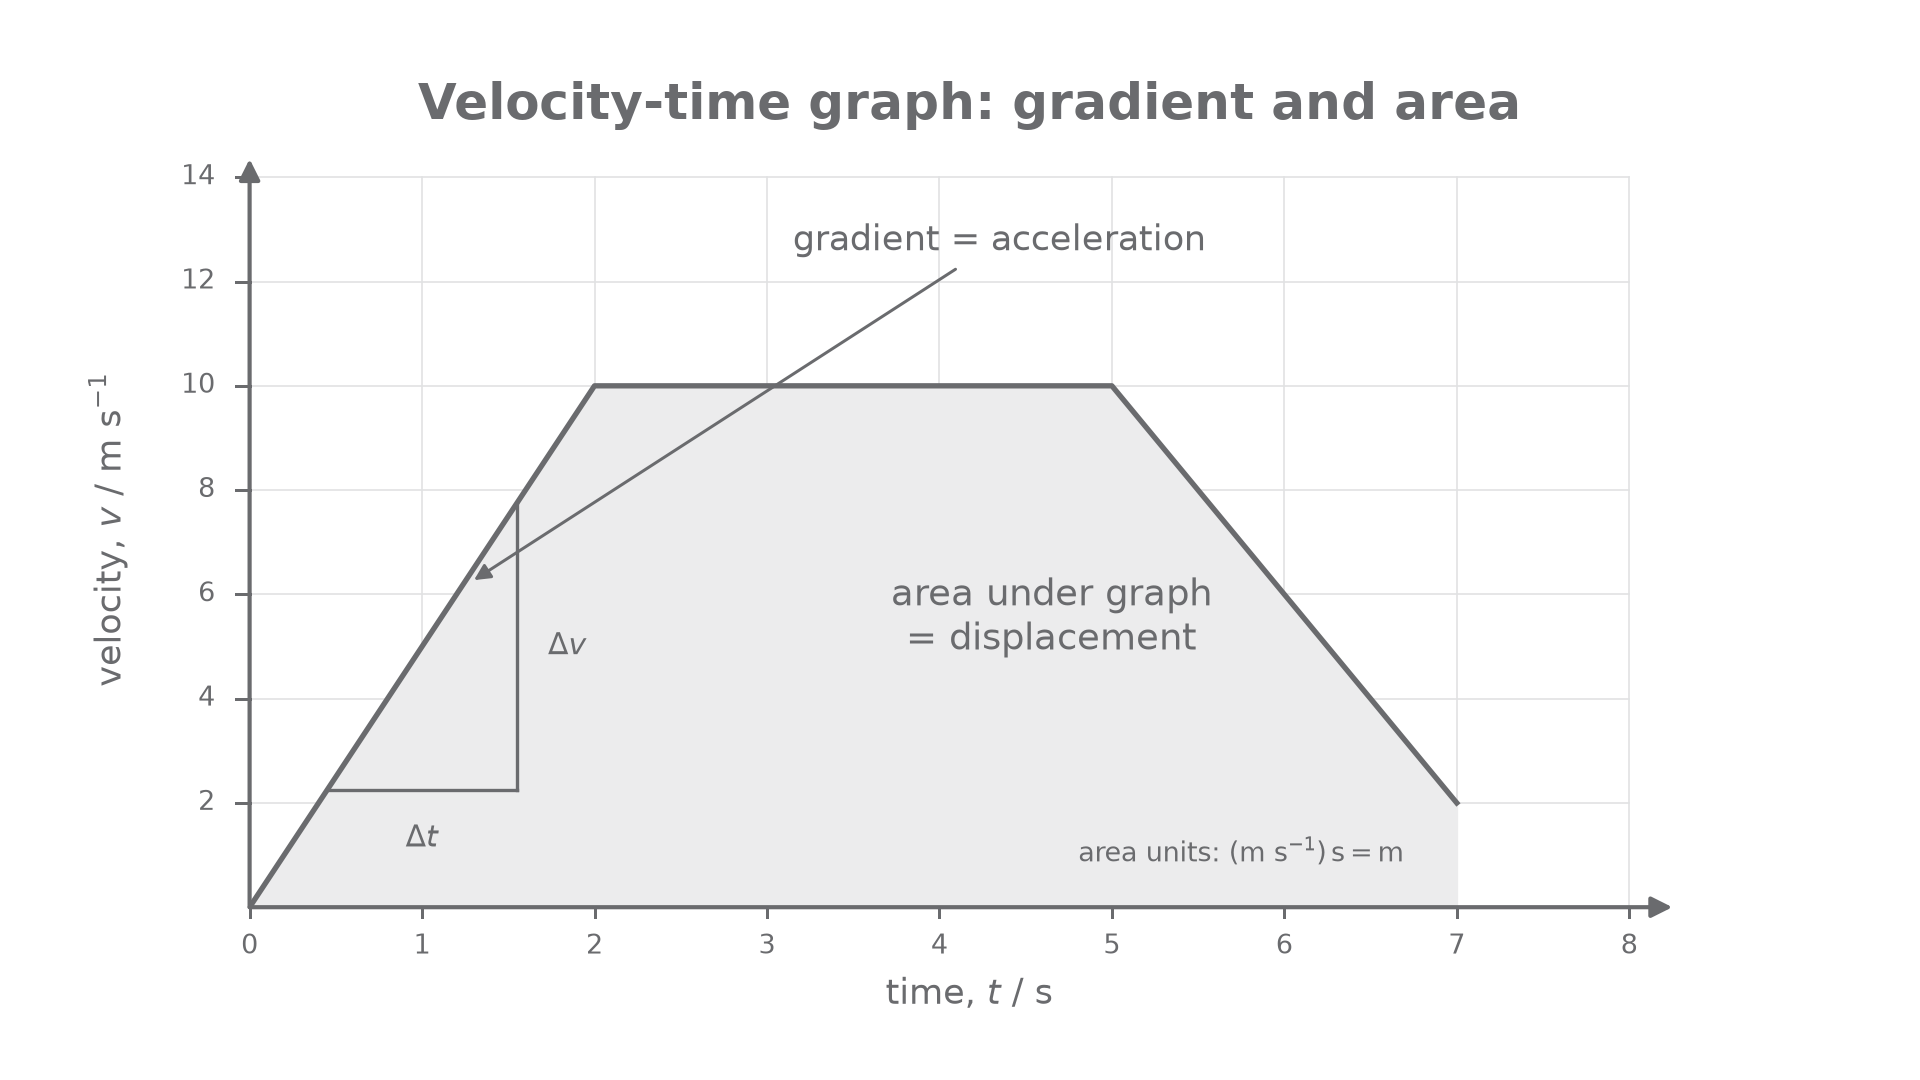
On a velocity-time graph, the vertical axis is velocity and the horizontal axis is time. This graph gives two different pieces of physical information.
The gradient gives acceleration:
Acceleration From A Velocity-Time Graph
The area under the graph gives displacement:
Displacement From A Velocity-Time Graph
The unit check is the quickest way to remember the area result:
The area has the unit of displacement.
[DIAGRAM: asset_name: Lesson 3.01.1: Kinematics Graphs and Rates - diagram 02; asset_slug: 3_01_1_kinematics_graphs_and_rates__diagram_02; recommended_method: drawn_physics; description: 16:9 NovaLearn-style velocity-time graph with axes labelled time t / s and velocity v / m s^-1. Piecewise linear motion rises, becomes constant, then falls. A large gradient triangle on the rising section is labelled Delta v and Delta t, with label "gradient = acceleration". The area under the graph is lightly shaded and labelled "area under graph = displacement"; include the unit note "(m s^-1) x s = m". White background, #6A6B6E only.]
Worked example: gradient and area from a velocity-time graph
A toy car has the following velocity-time graph:
- from
0 sto2.0 s, velocity increases uniformly from0to6.0 m s^-1 - from
2.0 sto5.0 s, velocity is constant at6.0 m s^-1
Acceleration in the first section:
Displacement in the first section is the triangular area:
Displacement in the second section is the rectangular area:
Total displacement:
This method works because each small area has the form velocity times time.
If the graph goes below the time axis, the velocity is negative. The area below the axis represents negative displacement. If a question asks for total distance travelled, you must add the magnitudes of the separate areas. If it asks for displacement, keep the signs.
Curves And Data-Loggers
Real motion data is often curved because velocity or acceleration changes continuously. A data-logger, light gate system, video analysis program or motion sensor can produce displacement-time or velocity-time data very quickly. The physics skill is still the same: interpret the graph.
For a curved displacement-time graph:
- draw a tangent at the time of interest;
- use two well-spaced points on the tangent;
- calculate the tangent gradient to estimate instantaneous velocity.
For a curved velocity-time graph:
- the tangent gradient estimates instantaneous acceleration;
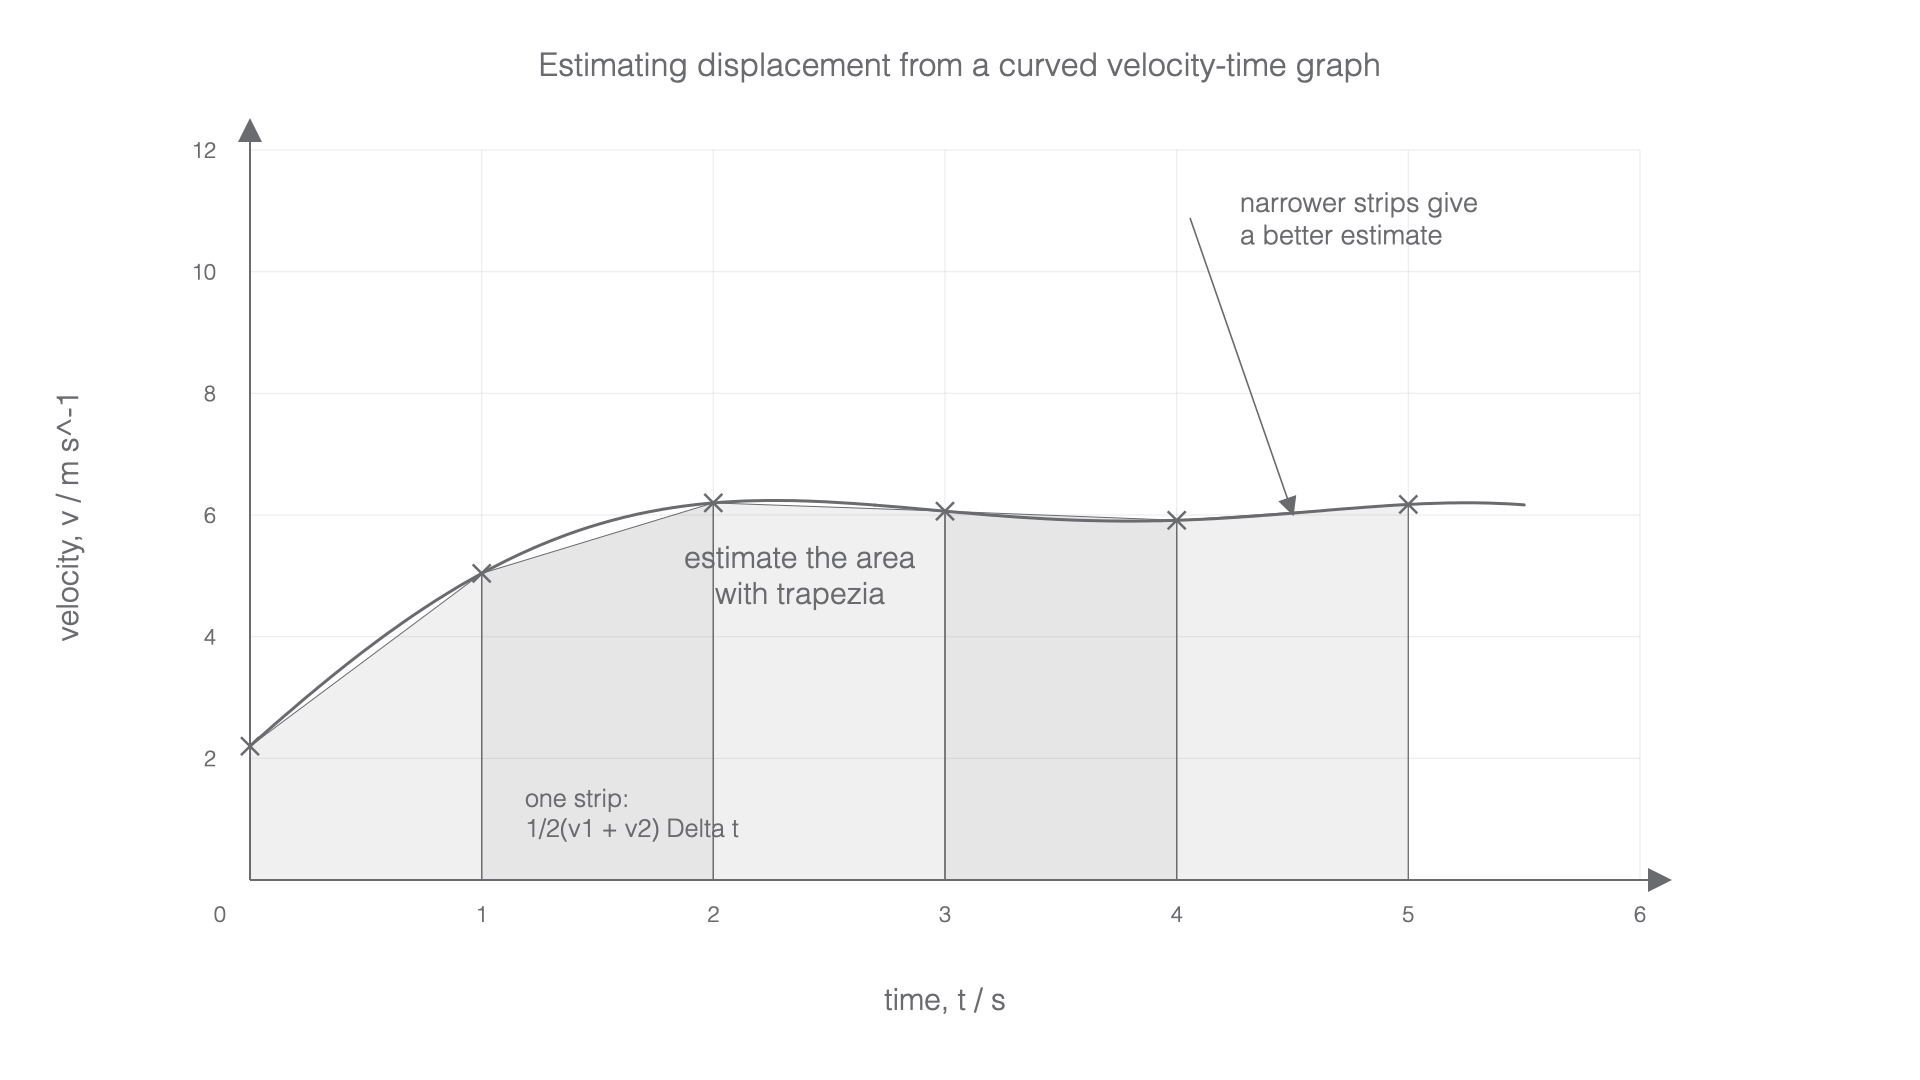
- the area under the curve estimates displacement;
- a finer grid, more strips or more frequent data samples usually improves the estimate.
[DIAGRAM: asset_name: Lesson 3.01.1: Kinematics Graphs and Rates - diagram 03; asset_slug: 3_01_1_kinematics_graphs_and_rates__diagram_03; recommended_method: drawn_physics; description: 16:9 NovaLearn-style curved velocity-time graph with axes labelled time t / s and velocity v / m s^-1. Smooth non-linear curve is sampled at equal one-second intervals with small crosses. Vertical strip boundaries and lightly shaded trapezia estimate area under the curve. Labels say "estimate the area with trapezia", "one strip: 1/2(v1 + v2) Delta t", and "narrower strips give a better estimate". White background, #6A6B6E only.]
Worked example: estimating area under a non-linear velocity-time graph
A motion sensor gives these velocity values:
t / s | 0 | 1 | 2 | 3 | 4 |
|---|---|---|---|---|---|
v / m s^-1 | 0.0 | 3.0 | 5.0 | 6.0 | 6.0 |
Estimate the displacement from 0 s to 4 s using trapezia of width 1 s.
First strip, from 0 s to 1 s:
Second strip:
Third strip:
Fourth strip:
Estimated displacement:
This is an estimate of the area under the non-linear graph. A data-logger with more frequent samples would let you use narrower strips and usually reduce the area-estimation uncertainty.
Graph presentation still matters in practical work. Use a conventional scale increasing left to right, label each axis with quantity and unit, and show gradient working clearly. If you use a gradient triangle, make it large enough to read accurately and use points on the line or tangent.
Choosing The Right Graph Tool
The same graph can contain several possible pieces of information, so first identify the axes.
Use this decision route:
- Read the vertical-axis quantity and unit.
- Read the horizontal-axis quantity and unit.
- Ask whether the question wants a value at one time, a rate of change, or a total change.
- Use the graph operation that matches the physical quantity.
| Graph | Operation | Gives |
|---|---|---|
| displacement-time | gradient | velocity |
| displacement-time | tangent gradient | instantaneous velocity |
| velocity-time | gradient | acceleration |
| velocity-time | area under graph | displacement |
Do not swap gradient and area. A gradient of a velocity-time graph has units:
That is acceleration. An area under a velocity-time graph has units:
That is displacement.
The most common mistakes are small but costly:
- using distance when displacement is required;
- using speed when velocity and direction are required;
- treating a curved graph as if one average gradient applies everywhere;
- calculating an area when the question asks for a rate of change;
- omitting units from gradients or areas;
- ignoring the sign of velocity below the time axis.
Worked example: selecting the method
A question says: "A graph shows velocity against time for a trolley. Determine the acceleration between 2.0 s and 6.0 s."
The graph is velocity-time, and the question asks for acceleration, a rate of change of velocity. Use the gradient between the two times.
A different question says: "A graph shows velocity against time for a trolley. Determine the displacement between 2.0 s and 6.0 s."
The graph is still velocity-time, but the question asks for displacement. Use the area under the graph between the two times.
Choosing The Right Graph Tool Continued
The habit to keep is simple: axes first, units second, then choose gradient or area. That sequence prevents most graph-method errors in kinematics.
Explain It Back
Use this as a self-explanation check after the section above. It is for diagnosing what you can already explain, not for learning new material from scratch.