1.2.2(f)-(j) - Circuits and wave apparatus
This lesson is about using electrical and wave apparatus well enough to collect trustworthy data. These skills can be assessed inside later electricity, waves, superposition and optics questions, so the aim here is practical competence: connect the apparatus correctly, choose sensible ranges, read scales, control risks and explain how the measurement gives the required quantity.
Constructing Circuits from Diagrams
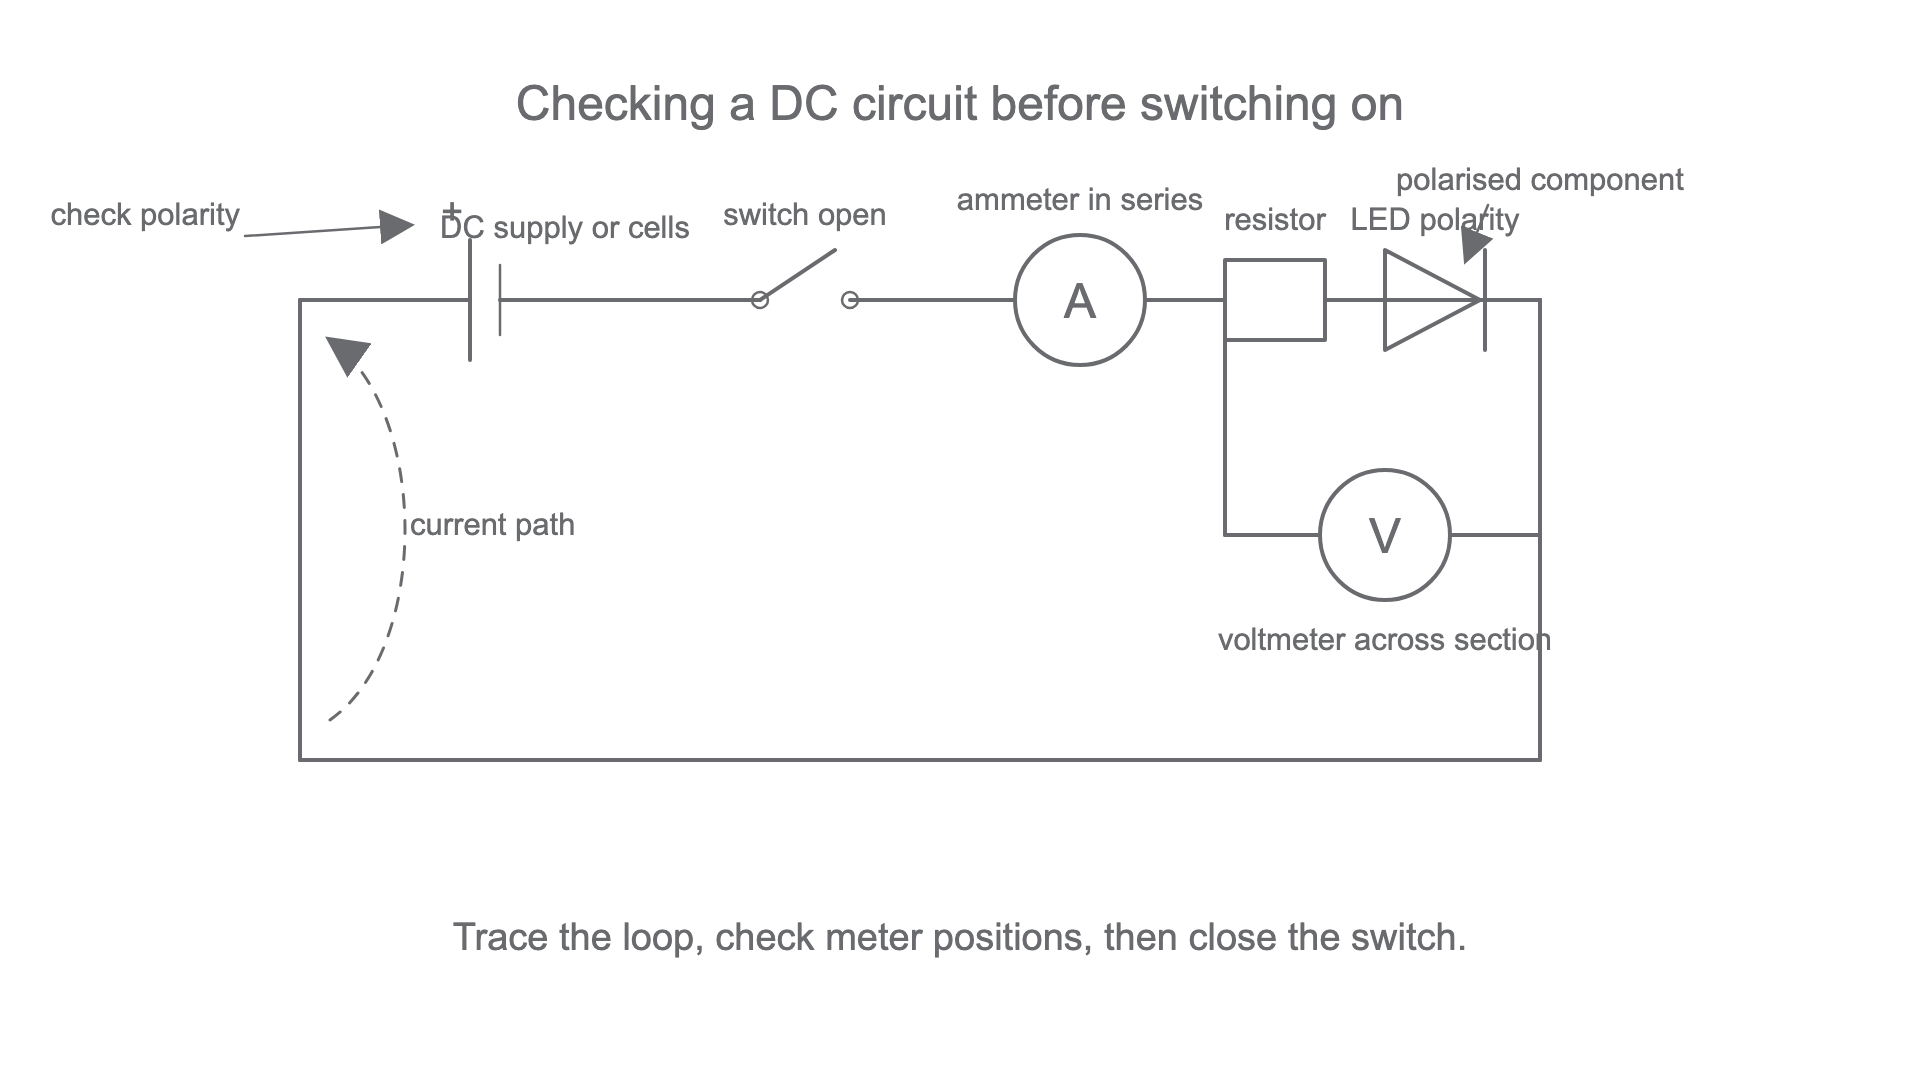
A circuit diagram is a set of instructions for the current path. Before any supply is switched on, translate the symbols into a real route: start at one terminal of the cell or DC power supply, follow the wire through each series component, and return to the other terminal. A complete loop is needed for current to flow.
For this practical-skills boundary, the important question is not "what is the full circuit theory?" but "can you build the circuit shown and check that it is safe and testable?"
[DIAGRAM: asset_name: Lesson 1.02.2b: Circuits, Oscilloscopes and Wave Apparatus - diagram 01; asset_slug: 1_02_2b_circuits_oscilloscopes_and_wave_apparatus__diagram_01; recommended_method: drawn_physics; description: Clean 16:9 drawn circuit-checking diagram on white background. Show a DC supply, switch, ammeter in series, protective resistor and LED in series with correct LED polarity. Show a voltmeter connected in parallel across the LED-resistor section. Label current path, positive terminal, LED polarity, ammeter in series and voltmeter in parallel.]
Polarity
Polarity means the required direction of connection for a component or instrument. A polarised component, such as a diode, LED or electrolytic capacitor, must be connected the correct way round.
When constructing a circuit from a diagram, use this sequence.
- Identify the supply type and range. Use cells or a low-voltage DC supply when the diagram specifies DC.
- Lay out the main series loop first, with the switch open.
- Put the ammeter in series with the part of the circuit whose current is being measured.
- Put a voltmeter, or an oscilloscope used as a voltmeter, across the component or signal being measured.
- Check the polarity of cells, DC supplies, meters and any polarised components.
- Start with a low supply voltage or a high resistance setting when a variable supply or variable resistor is used.
A common practical-answer error is to say only "put the meter in parallel" without naming what it is across. Precision matters: a voltmeter is connected in parallel across the component of interest; an ammeter is connected in series in the current path being measured.
Worked example: building before switching on
A student is asked to construct a circuit containing a DC supply, switch, resistor, LED and ammeter, then measure the p.d. across the LED.
- The current path is: positive supply terminal, switch, ammeter, resistor, LED, negative supply terminal.
- The LED must be connected in its conducting direction for the intended current.
- The ammeter is in series, so all the current through the LED also passes through the ammeter.
- The voltmeter is connected across the LED only if the required reading is the LED p.d.; it is connected across the resistor and LED together only if that combined p.d. is required.
- The switch is left open until the teacher or student has checked the circuit.
Build the current path first, then add measuring instruments in the correct position. Most circuit faults are easier to spot before the supply is switched on.
Designing and Checking Circuits
Designing a circuit means choosing an arrangement that answers the experimental question. The design should specify what is varied, what is measured, what is kept constant, and how the circuit will be checked before data are taken.
For practical-skills questions, a good circuit method usually includes:
- the power source, such as cells or a DC power supply
- a switch so the circuit can be made safe between readings
- a protective component if a device could be damaged by too large a current
- the component or section being investigated
- meters connected to measure the required current and p.d.
- a way to vary the independent variable, such as a variable resistor or variable supply, when appropriate
Do not rely on the power supply display alone unless the method says that its display has suitable resolution and has been checked. A digital multimeter can be used to verify p.d., current or resistance, but in this lesson the important circuit skill is the connection choice, not the detailed operation of every meter.
Checking is also part of the design. Before powering a circuit, trace the current path with a finger or pencil, check there is no short circuit across the supply, and check that the meters are on suitable ranges. If the ammeter reads backwards, the polarity is reversed. If the current is unexpectedly large, switch off before changing connections.
Worked example: choosing connections for an I-V style circuit
Suppose the aim is to measure the current through a component and the p.d. across that same component for several supply settings.
- Independent variable: supply p.d. or variable resistor setting.
- Dependent variables: current through the component and p.d. across it.
- Ammeter position: in series with the component.
- Voltmeter position: in parallel across the component.
- Control choices: keep the same component, avoid heating if temperature would affect readings, and keep contact resistance small by using secure leads.
- Check: start at low current, increase gradually, and switch off between readings if heating is significant.
The exact component behaviour belongs in later electricity lessons. The practical skill here is that the measuring circuit must actually measure the quantities claimed.
Signal Generator and Oscilloscope
A signal generator produces a repeating electrical signal. The user can usually vary the frequency, amplitude and waveform. An oscilloscope displays voltage against time. It does not produce the signal; it helps measure or compare signals.
Time-base
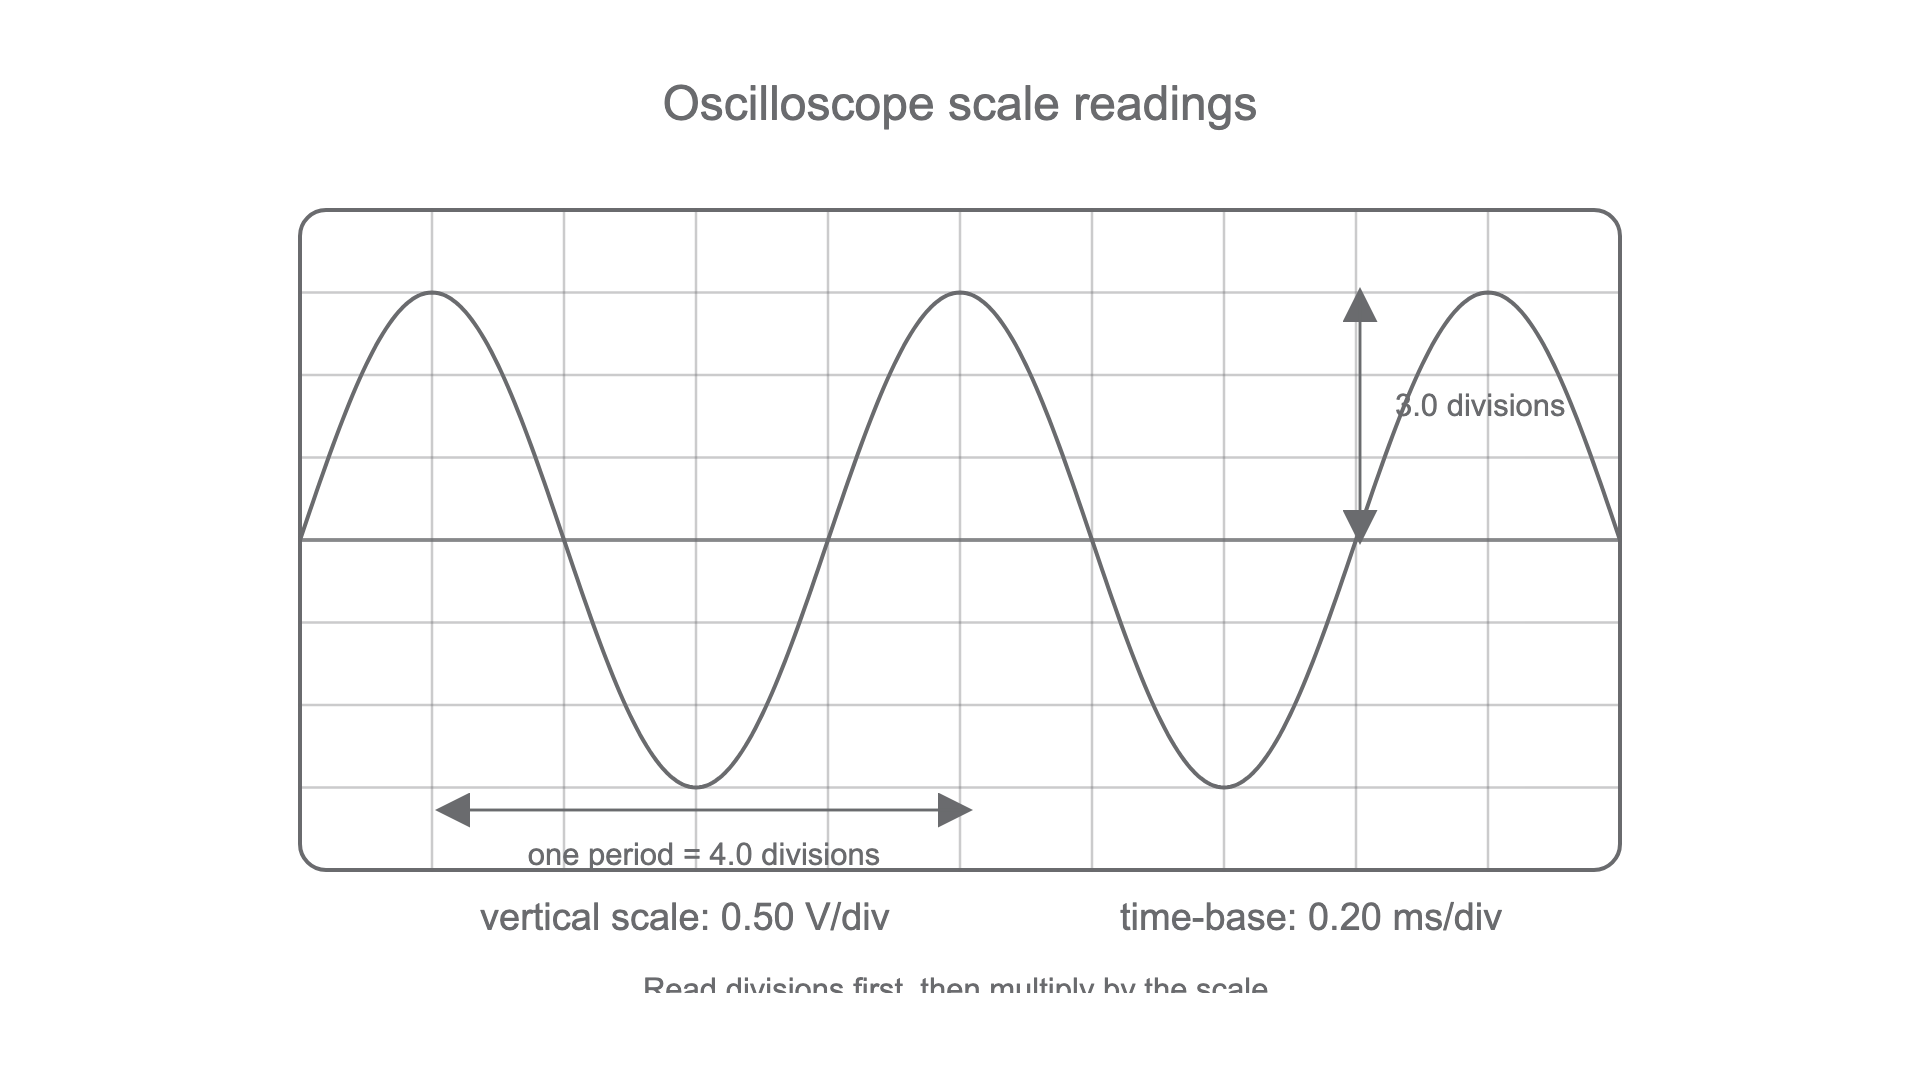
The time-base is the horizontal scale on an oscilloscope display. A setting such as 0.20 ms/division means each large horizontal division represents 0.20 ms.
The vertical scale is often called volts per division or y-sensitivity. If a trace is 3.0 divisions above the centre line and the vertical scale is 0.50 V/division, the peak voltage is:
Oscilloscope Scale Readings
Here, n_y is the number of vertical divisions from the centre line to the peak, n_x is the number of horizontal divisions for one full cycle, T is the period in seconds, and f is the frequency in hertz.
[DIAGRAM: asset_name: Lesson 1.02.2b: Circuits, Oscilloscopes and Wave Apparatus - diagram 02; asset_slug: 1_02_2b_circuits_oscilloscopes_and_wave_apparatus__diagram_02; recommended_method: drawn_physics; description: Clean 16:9 drawn oscilloscope graticule with sinusoidal trace. Label centre line, amplitude as 3.0 divisions from centre to peak, one period as 4.0 horizontal divisions, vertical scale 0.50 V/div, time-base 0.20 ms/div, and show that peak voltage and period are read from divisions.]
Worked example: reading a trace
An oscilloscope trace has an amplitude of 3.0 vertical divisions from the centre line. One complete cycle occupies 4.0 horizontal divisions. The voltage scale is 0.50 V/division and the time-base is 0.20 ms/division.
Peak voltage:
V = 3.0 x 0.50 V = 1.5 V
Period:
T = 4.0 x 0.20 ms = 0.80 ms
Convert to seconds:
0.80 ms = 0.80 x 10^-3 s = 8.0 x 10^-4 s
Frequency:
f = 1 / T = 1 / (8.0 x 10^-4) = 1.25 x 10^3 Hz
So the signal has peak voltage 1.5 V and frequency 1.25 kHz.
Two practical details often decide whether a real reading is useful.
- Use a time-base that shows at least one full cycle clearly. If the trace is too compressed or too spread out, the period reading is poor.
- Use a vertical scale that keeps the trace on screen without making it tiny. A larger trace usually reduces percentage uncertainty in the voltage reading.
Generating and Measuring Waves
Wave apparatus has three jobs: generate a wave, detect or display it, and let you measure a useful quantity. The specification lists several acceptable apparatus families, so you should be able to explain the method in words even if the exact equipment changes.
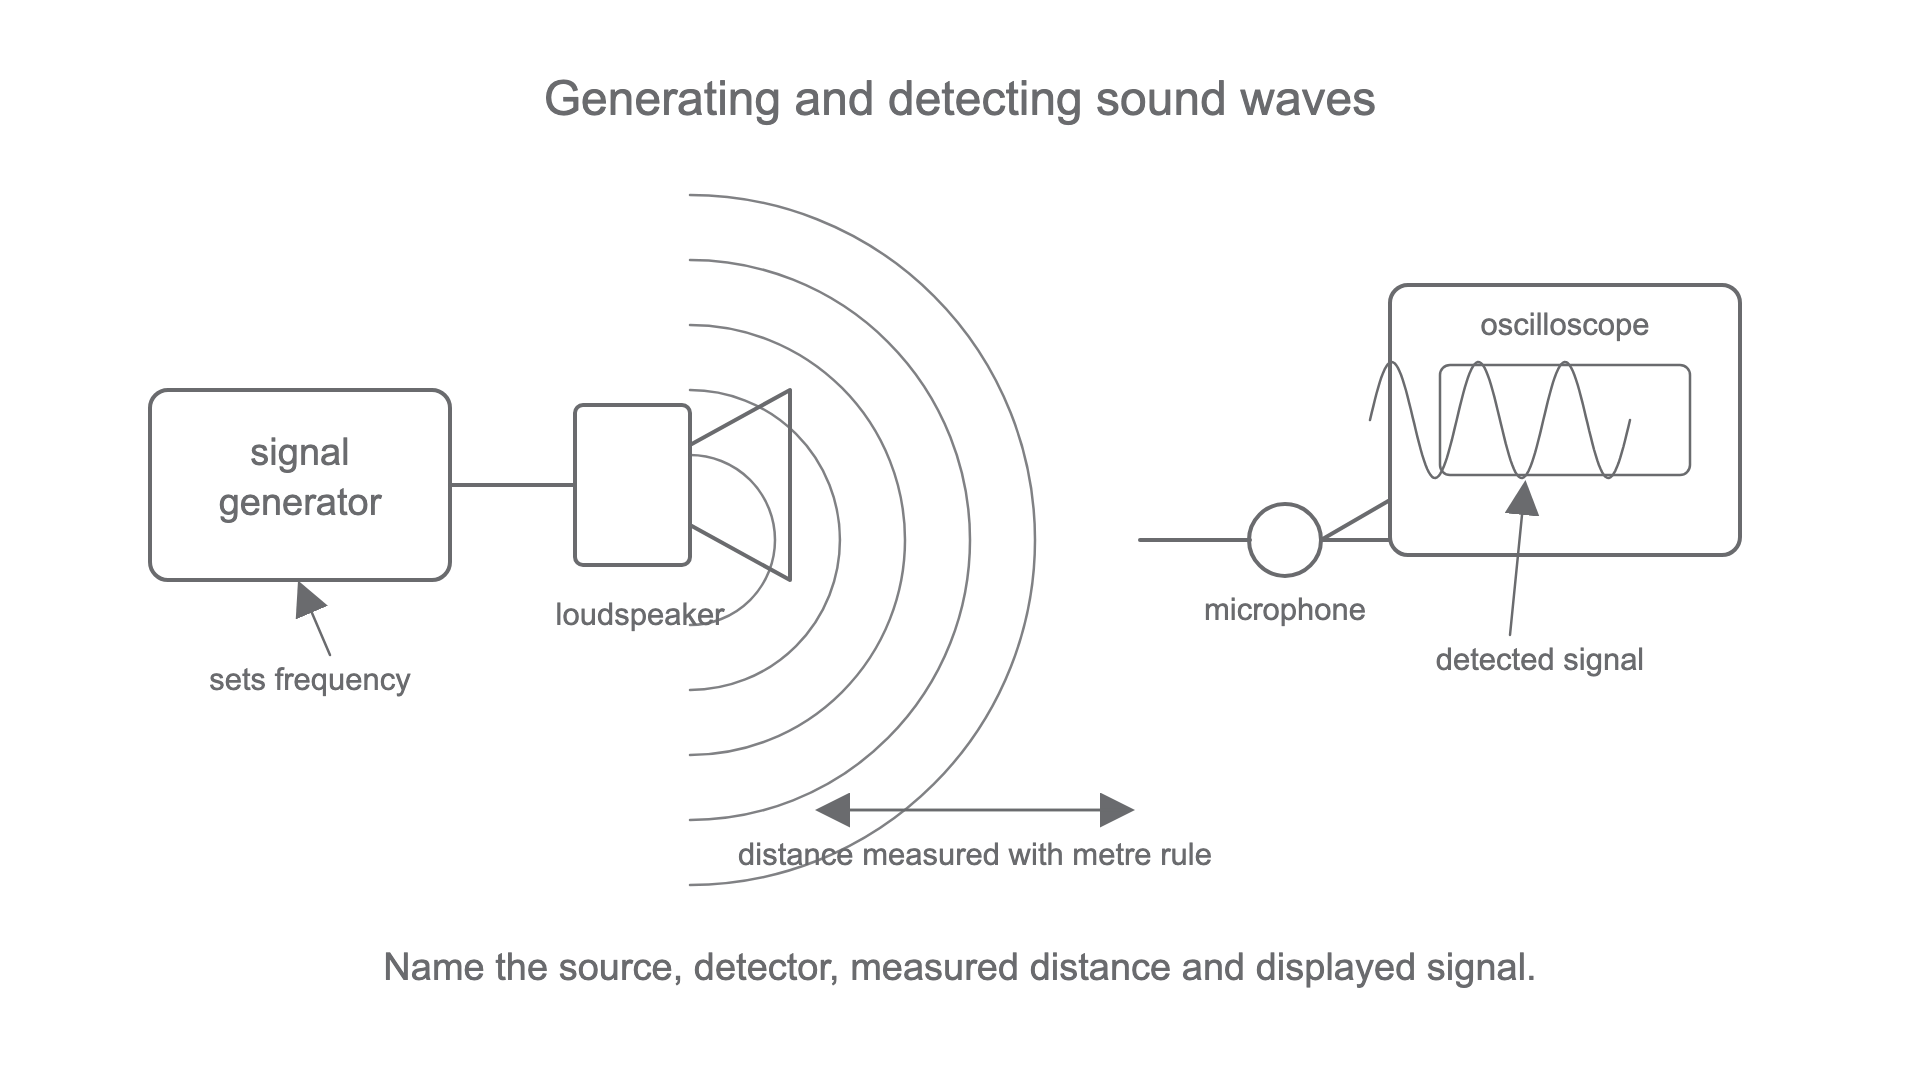
For sound waves, a signal generator can drive a loudspeaker. A microphone connected to an oscilloscope detects the sound as a voltage signal. The signal generator gives a set frequency, while the oscilloscope can be used to check period or compare signals.
[DIAGRAM: asset_name: Lesson 1.02.2b: Circuits, Oscilloscopes and Wave Apparatus - diagram 03; asset_slug: 1_02_2b_circuits_oscilloscopes_and_wave_apparatus__diagram_03; recommended_method: drawn_physics; description: Clean 16:9 drawn sound-wave measurement setup. Show signal generator connected to loudspeaker, sound wavefronts travelling to a microphone, microphone connected to oscilloscope, metre rule measuring speaker-microphone separation, and labels for frequency from generator, detected signal on oscilloscope and distance measurement.]
For a ripple tank, a vibrating dipper or bar creates circular or straight water waves. A lamp or stroboscope makes the wavefronts visible. Wavelength can be found by measuring the distance across several crest spacings and dividing by the number of wavelengths. If a projected image is used, either work consistently on the projected scale or use the calibration/magnification to convert back to the actual water-surface wavelength before calculating the actual wave speed. Frequency can be taken from the generator or found from the vibration rate if that is the measured quantity.
For a vibration transducer on a string, the transducer generates oscillations and the length, tension or frequency can be varied depending on the investigation. For microwave or radio-wave sources, a detector or receiver is moved to find maxima, minima or changes in signal. The exact wave theory is taught later; the apparatus skill is to state what is generated, what is detected and what is measured.
Worked example: ripple tank wavelength and speed
In a ripple tank, the distance across 10 wavefront spacings on the projected image is 18.0 cm. The frequency of the vibrator is 24 Hz.
Mean wavelength on the image:
lambda = 18.0 cm / 10 = 1.80 cm = 1.80 x 10^-2 m
If the projected image is calibrated so that the measured screen spacing represents the water-surface spacing, the water-wave speed is:
v = f lambda = 24 x 1.80 x 10^-2 = 0.432 m s^-1
If the screen pattern is magnified and has not been calibrated, this is only the speed on the projected scale; convert the wavelength back to the water-surface scale before quoting the actual wave speed.
The method is better than measuring just one crest spacing because averaging over several wavelengths reduces percentage uncertainty.
Practical improvements include using a stroboscope to freeze the pattern, keeping water shallow and level, damping reflections from the edges if they affect readings, and repeating measurements at different positions rather than relying on one unclear crest.
Laser and Light-Source Investigations
This apparatus boundary expects students to use a laser or light source to investigate characteristics of light, including interference and diffraction. In this lesson, focus on the apparatus method: how the source, slit or grating, and screen are arranged, how measurements are made, and how risks are controlled.
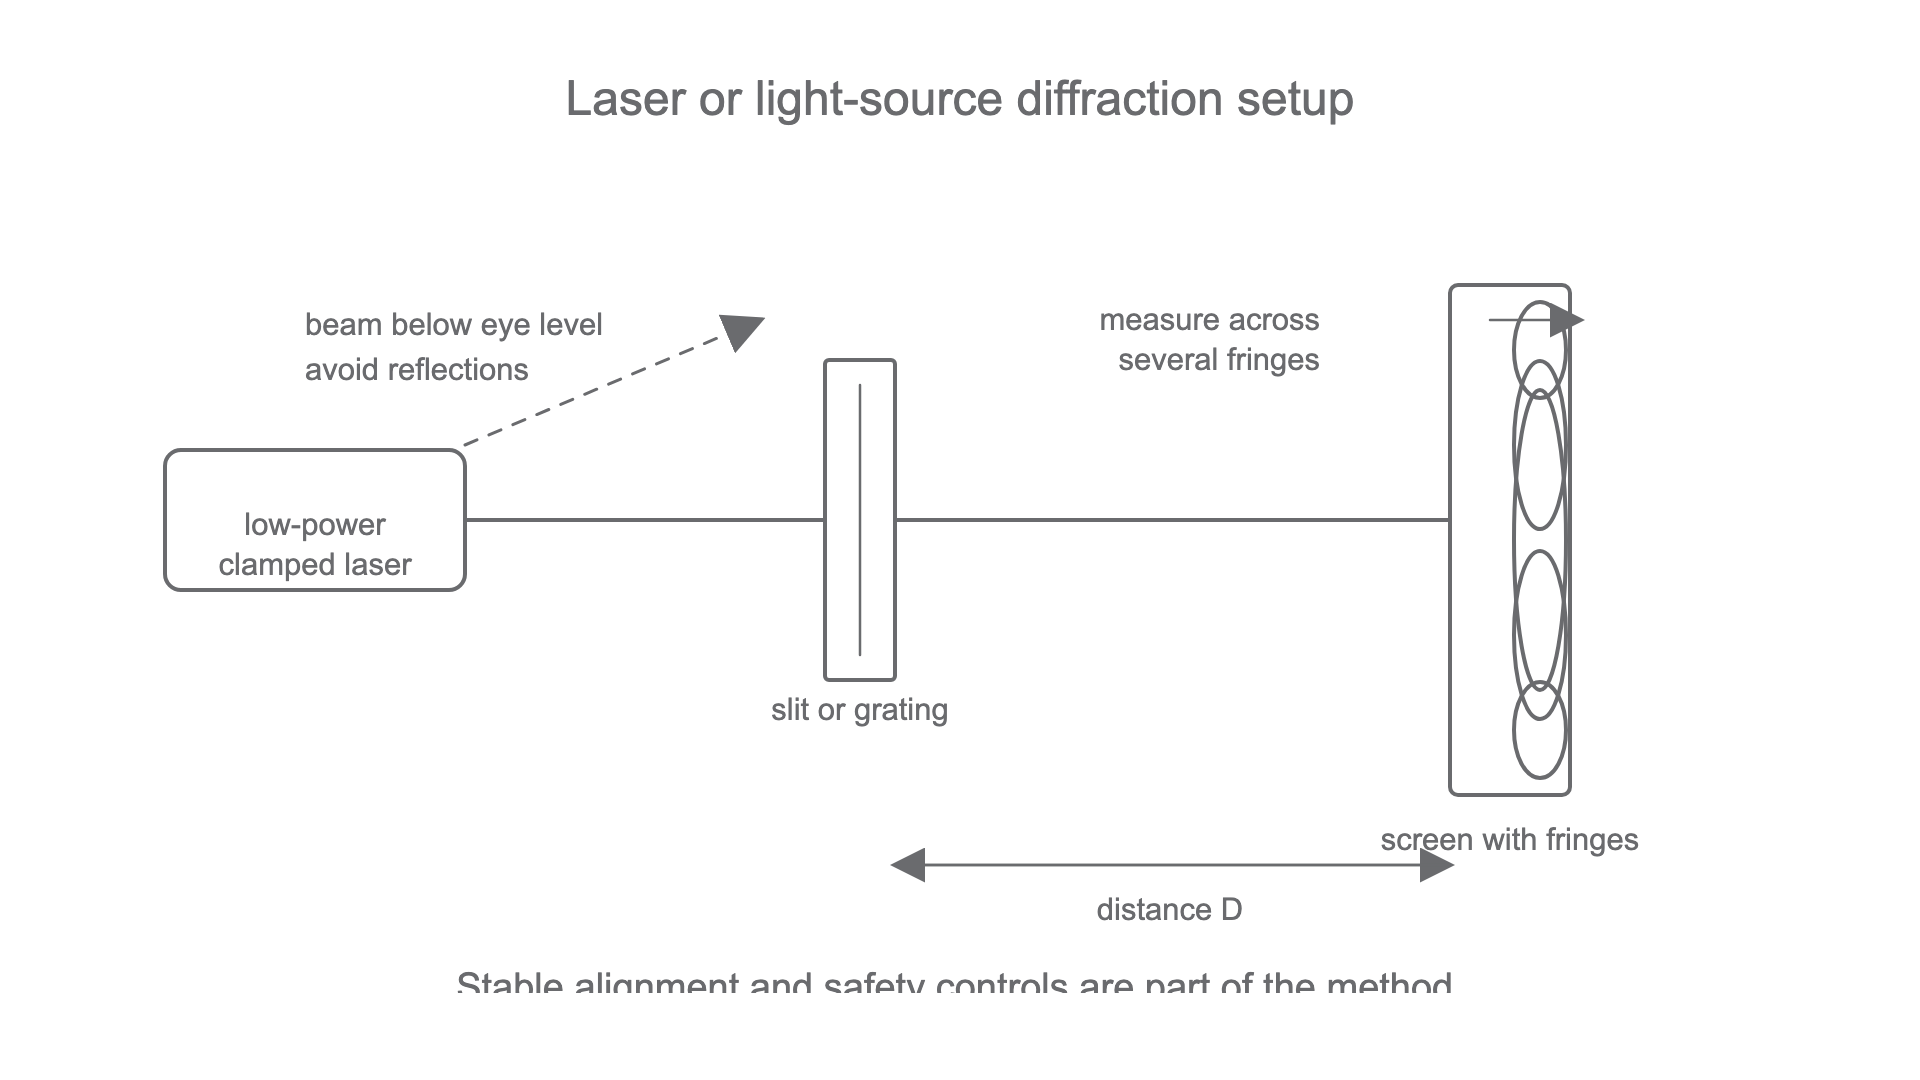
A typical laser diffraction or interference arrangement has:
- a low-power educational laser or suitable light source
- a slit, double slit, wire or diffraction grating
- a screen or graph paper placed a measured distance away
- a darkened room only if needed to improve visibility
- a clamped source so the beam path is stable and below eye level
[DIAGRAM: asset_name: Lesson 1.02.2b: Circuits, Oscilloscopes and Wave Apparatus - diagram 04; asset_slug: 1_02_2b_circuits_oscilloscopes_and_wave_apparatus__diagram_04; recommended_method: drawn_physics; description: Clean 16:9 drawn laser/light-source investigation setup. Show clamped low-power laser on left, narrow slit or diffraction grating in centre, screen on right with central bright fringe and symmetrical fringes. Label measured distance D, fringe spacing measured across several intervals, beam below eye level, and avoid reflective objects.]
Diffraction
Diffraction is the spreading of a wave when it passes through a gap or around an obstacle. In a light experiment it can produce a pattern of bright and dark regions on a screen.
Interference
Interference is the effect of superposing waves. For light, it can produce bright regions where waves arrive in phase and dark regions where they arrive out of phase.
For this apparatus boundary, do not jump straight to a formula. First describe what the student actually does:
- Clamp the source and direct it at the slit or grating and then at the screen.
- Measure the distance from the slit or grating to the screen.
- Mark or read several bright-fringe positions, not just one spacing.
- Divide the total distance across several intervals by the number of intervals to find a mean spacing.
- Repeat or adjust the setup if the pattern is blurred, asymmetric or too small to measure.
- Control risk by keeping the beam away from eyes, avoiding reflective objects and switching off when adjusting.
Safety is not decorative here. A laser beam can damage eyes, so the method should state that the beam is low power, clamped, directed away from people and kept below eye level. Reflections from shiny objects also matter.