2.18-2.20 - Photosynthesis reactions and limiting factors
Photosynthesis is the process that lets flowering plants trap light energy and store it as chemical energy in glucose. In this lesson, the process is treated as an energy conversion, a pair of equations, and a set of rate patterns. The key exam skill is to connect the graph shape to the factor that is limiting the rate.
What photosynthesis does
Photosynthesis is more than "plants make food". It is the process in which light energy is transferred into chemical energy stored in glucose. The plant can then use this glucose in cells, for example as a source of energy in respiration or as a starting point for other plant substances.
Photosynthesis
Photosynthesis is the process by which plants use light energy to make glucose from carbon dioxide and water, releasing oxygen as a product.
In green plant cells, light is absorbed by chlorophyll in chloroplasts. Carbon dioxide and water are the raw materials. Glucose and oxygen are the products. The important energy idea is that the plant does not create energy; it converts light energy into chemical energy in the bonds of glucose.
[DIAGRAM: asset_name: Photosynthesis reactions and limiting factors - diagram 01; asset_slug: b09_photosynthesis_reactions_and_limiting_factors__diagram_01; recommended_method: deterministic_drawing; description: Monochrome flow diagram showing light energy entering photosynthesis, carbon dioxide and water as inputs, glucose with stored chemical energy and oxygen as outputs.]
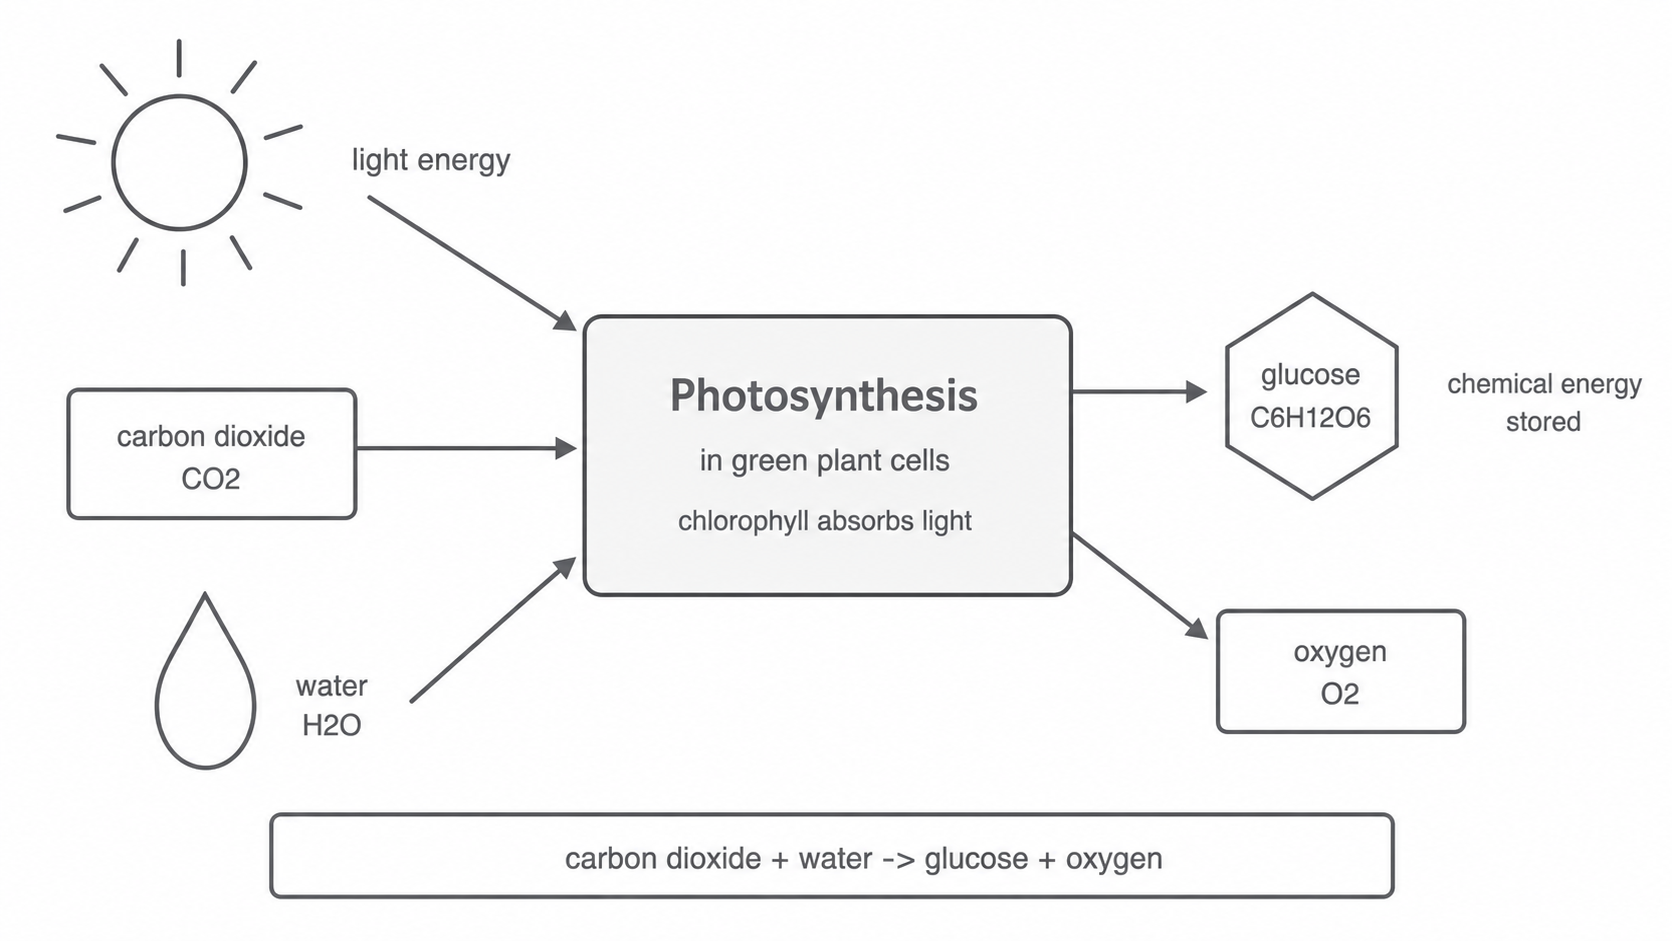
This matters because glucose made by photosynthesis can be used by the plant and can pass through food chains when organisms eat plants or plant products. Oxygen released during photosynthesis is also a product of the reaction.
The photosynthesis equations
The word equation names the reactants and products:
Word equation
The balanced symbol equation shows the same reaction using formulae and coefficients:
Balanced symbol equation
Light energy is shown over the arrow because it is needed for the reaction, but it is not a substance being balanced. Chlorophyll is also needed to absorb the light, but chlorophyll is not used up as a reactant in the equation.
The equation is balanced because the numbers of atoms are the same on both sides: 6 carbon atoms, 12 hydrogen atoms, and 18 oxygen atoms. A common error is to write oxygen as O instead of O2, or to forget the big numbers in front of CO2, H2O and O2.
Rate and limiting factors
The rate of photosynthesis means how fast photosynthesis is happening. In exam data, the rate might be shown as glucose made per unit time, oxygen produced per unit time, or simply as "rate of photosynthesis" in arbitrary units.
Limiting factor
A limiting factor is the factor in shortest supply that restricts the rate of a process.
For photosynthesis, the three limiting factors in this lesson are carbon dioxide concentration, light intensity and temperature. If the limiting factor is increased, the rate can increase. If a factor is not limiting, increasing it has little or no effect because something else is holding the process back.
This idea explains why photosynthesis graphs often rise and then level off. In the rising part, the factor on the x-axis is limiting. In the flat part, the factor on the x-axis is no longer limiting; another factor is restricting the rate.
Light intensity and carbon dioxide concentration
Light intensity affects the amount of light energy available for photosynthesis. At low light intensity, light is usually the limiting factor, so increasing light intensity increases the rate. Eventually the rate levels off because the plant has enough light for the current conditions and another factor, such as carbon dioxide concentration or temperature, limits the rate.
Carbon dioxide concentration affects the supply of one raw material for photosynthesis. At low carbon dioxide concentration, carbon dioxide is limiting, so increasing its concentration increases the rate. At higher concentrations the curve levels off because another factor is now limiting.
When you interpret these graphs, do not just say "it increases then stays the same". Add the biological reason: the x-axis factor is limiting in the rising region, then another factor becomes limiting at the plateau.
Temperature and graph questions
Photosynthesis depends on enzyme-controlled reactions, so temperature affects its rate differently from light intensity and carbon dioxide concentration. At low temperatures, the reactions are slow. As temperature rises, the rate increases because the reactions happen faster.
The rate reaches an optimum temperature. Above the optimum, the rate falls because enzymes become denatured: their active sites change shape, so the reactions involved in photosynthesis cannot happen as effectively.
[DIAGRAM: asset_name: Photosynthesis reactions and limiting factors - diagram 02; asset_slug: b09_photosynthesis_reactions_and_limiting_factors__diagram_02; recommended_method: matplotlib; description: Monochrome three-panel graph showing rate of photosynthesis against light intensity, carbon dioxide concentration and temperature, including plateau regions and a temperature optimum.]
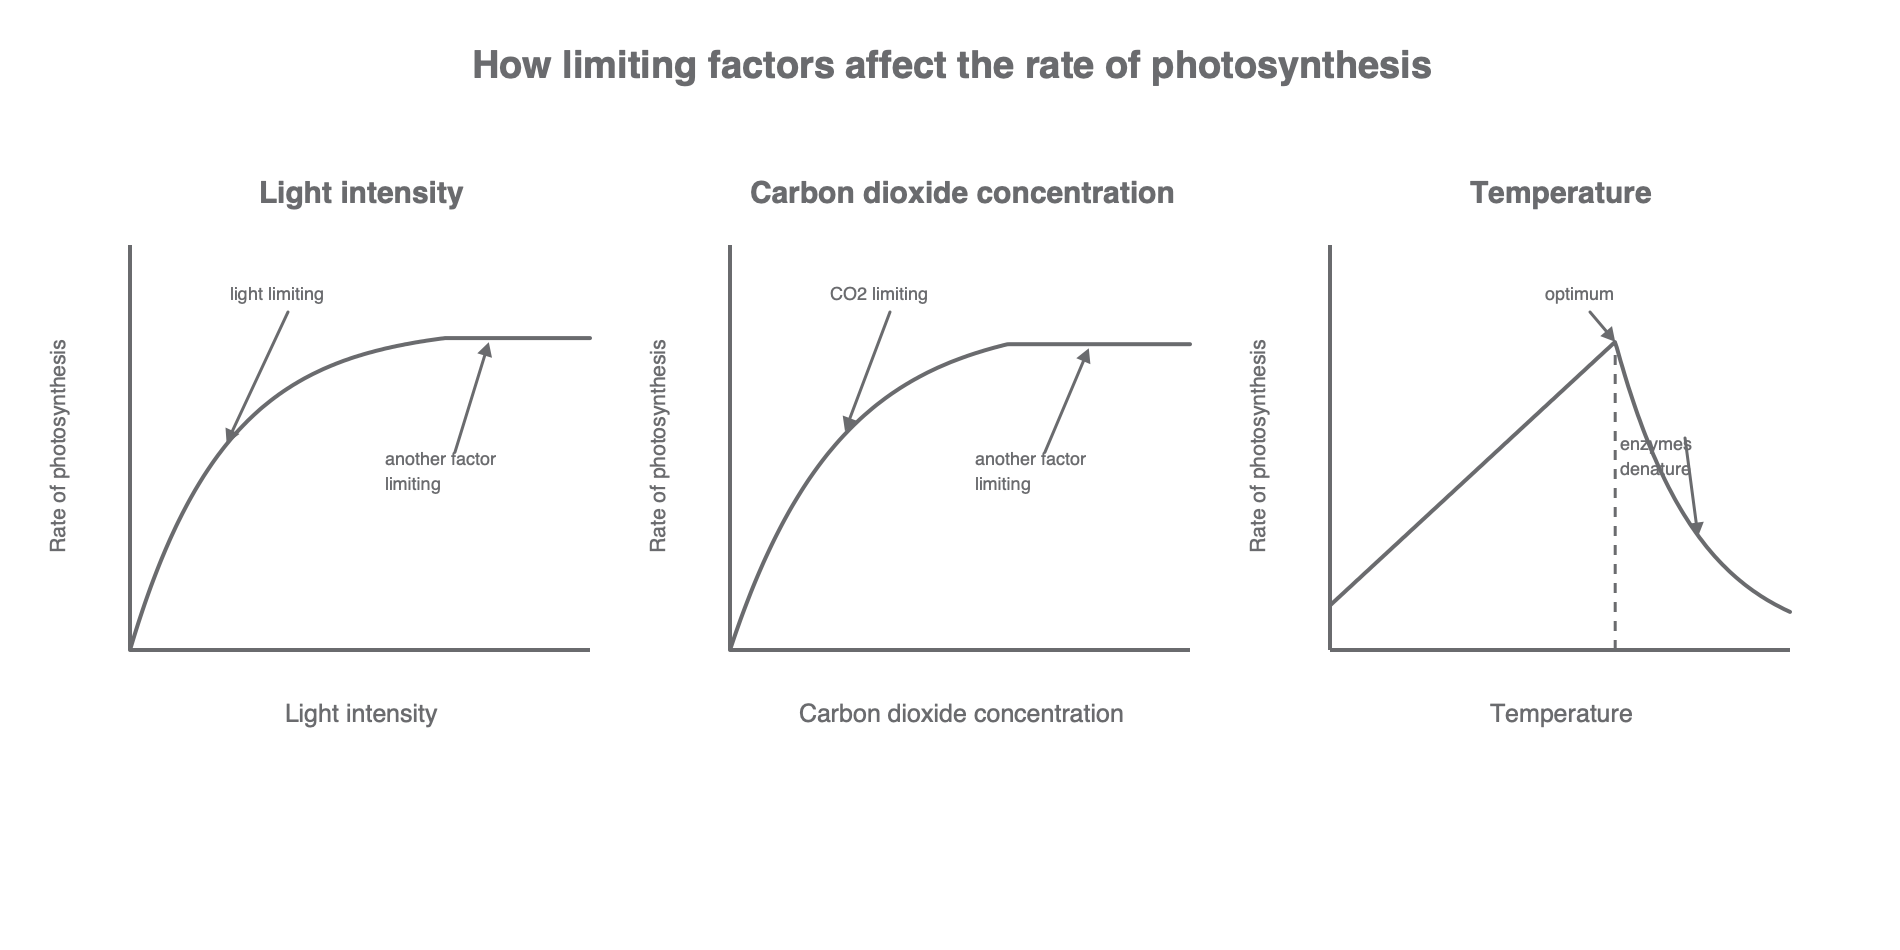
For graph questions, identify the limiting factor from the shape of the curve:
- If the curve is rising as the x-axis value increases, the x-axis factor is limiting.
- If the curve is flat, the x-axis factor is no longer limiting and another factor is limiting.
- If the temperature curve has passed its optimum and is falling, high temperature is reducing the rate because enzymes are denatured.