2.13-2.14B - Enzyme activity and pH practical
Enzymes work because their active sites have a particular shape. This lesson shows how changing pH can alter that shape, then uses a practical investigation to measure the effect of pH on enzyme activity. The practical model is amylase digesting starch, with iodine solution used to show when starch is still present.
pH and the active site
pH describes how acidic or alkaline a solution is. A low pH is acidic, pH 7 is neutral, and a high pH is alkaline.
Optimum pH
The optimum pH of an enzyme is the pH at which that enzyme has its highest activity.
An enzyme's active site is held in a precise three-dimensional shape. If the pH changes away from the enzyme's optimum, the charges and bonds that help maintain that shape can be altered. The active site may no longer be complementary to the substrate, so fewer enzyme-substrate complexes form and the reaction rate decreases.
At very unsuitable pH values, the active site may change shape so much that the enzyme is denatured. In an exam answer, do not stop at "the enzyme is denatured": link it to the active site changing shape and the substrate no longer fitting.
pH affects enzyme activity because it can alter the shape of the active site.
Measuring amylase activity
A common way to investigate pH and enzyme activity is to use amylase. Amylase catalyses the breakdown of starch into maltose.
Amylase
Amylase is an enzyme that breaks down starch into maltose.
Starch can be detected using iodine solution, sometimes described as iodine in potassium iodide solution. If starch is present, iodine changes from orange-brown to blue-black. If starch is absent, iodine stays orange-brown.
This means enzyme activity can be measured by timing how long the reaction mixture takes to stop giving a positive starch test. A shorter time means starch has been digested faster, so the enzyme activity is higher.
Relative enzyme activity
Use consistent units. If time is measured in seconds, relative activity has units of s^-1; if time is measured in minutes, it has units of min^-1.
Practical method
[DIAGRAM: asset_name: Practical setup and iodine sampling sequence; asset_slug: b07_enzyme_activity_and_ph_practical__diagram_01; recommended_method: deterministic_drawing; description: Monochrome apparatus diagram showing starch solution, amylase plus pH buffer, water bath temperature control, stopwatch timing, and sequential iodine tests on a spotting tile.]
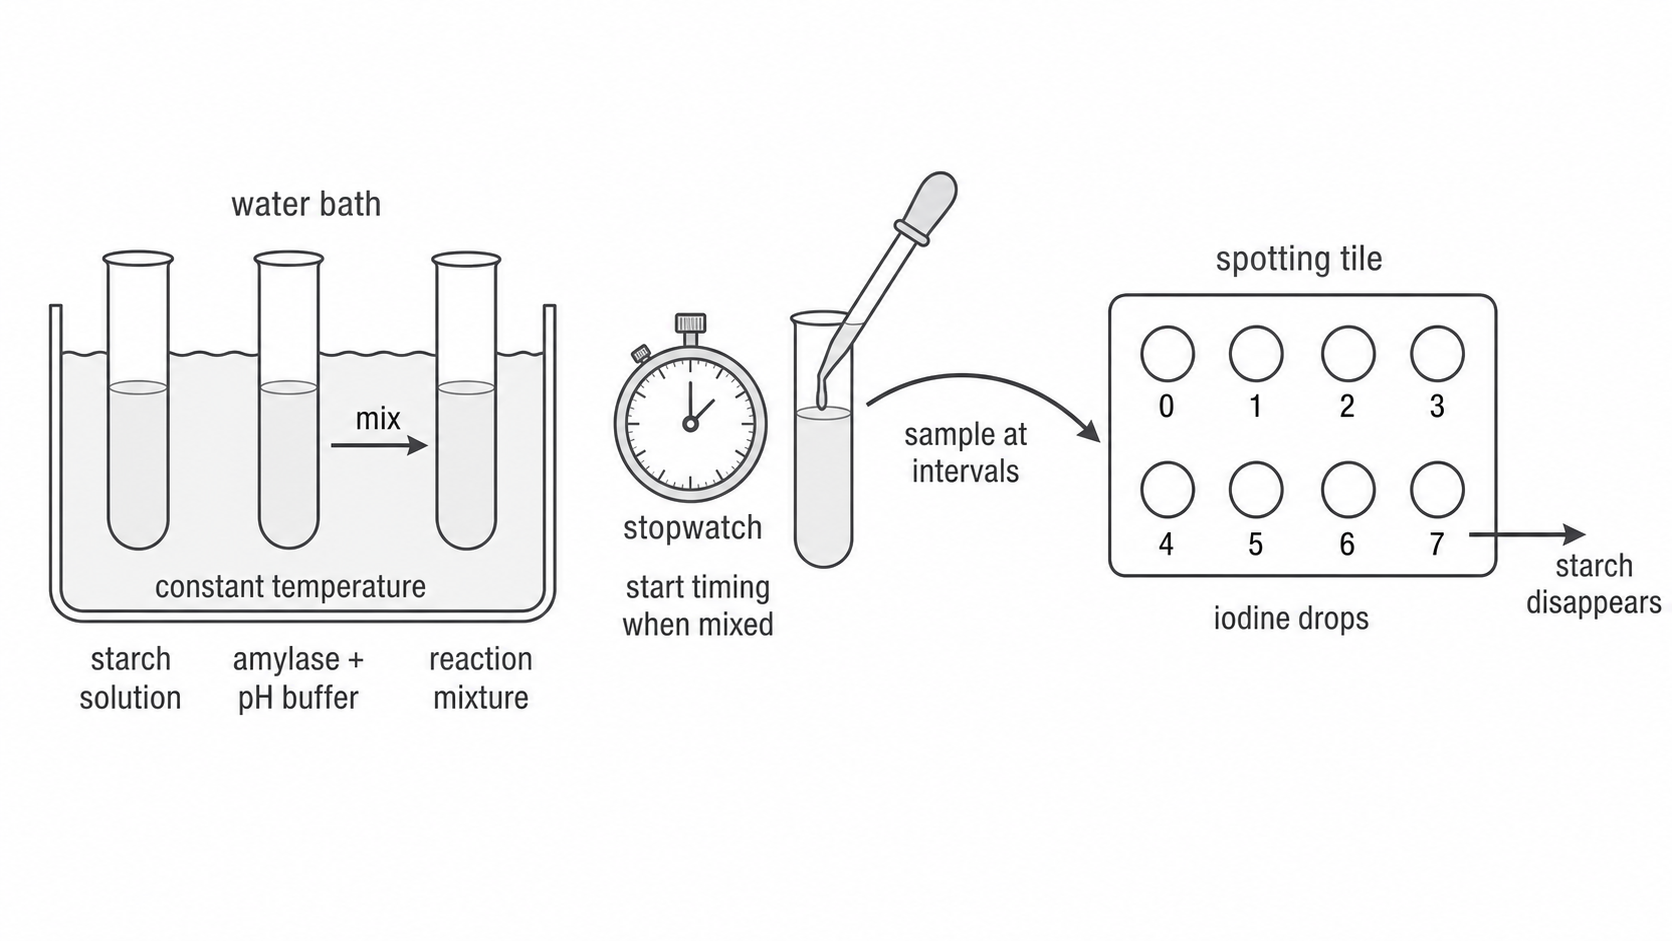
The investigation changes pH and measures how quickly starch is digested by amylase.
- Wear eye protection. Iodine solution, acidic pH solutions, and alkaline pH solutions can irritate eyes and skin.
- Place drops of iodine solution into the wells of a spotting tile.
- Put measured volumes of starch solution and amylase plus a pH solution into separate test tubes.
- Place the test tubes in the same water bath so both solutions reach the same temperature.
- Mix the starch with the amylase and pH solution, then start the stopwatch immediately.
- At fixed time intervals, remove a small sample of the reaction mixture and add it to a fresh iodine drop.
- Record the first time when iodine stays orange-brown, showing that starch is no longer detected.
- Repeat the method at different pH values and repeat trials so a mean time can be calculated.
The pH solution may be a prepared buffer solution. In the Pearson International GCSE practical guidance, pH can also be changed using different amounts of sodium carbonate solution or ethanoic acid, with the pH checked using universal indicator paper.
The independent variable is pH. The dependent variable is the time taken for starch to disappear, or the calculated value of 1/time. Important control variables include temperature, volume of amylase, concentration of amylase, volume of starch, concentration of starch, total reaction volume, and the sampling interval.
Interpreting results
[DIAGRAM: asset_name: Enzyme activity against pH graph; asset_slug: b07_enzyme_activity_and_ph_practical__diagram_02; recommended_method: matplotlib; description: Monochrome graph of relative enzyme activity against pH, showing low activity at unsuitable pH values, a peak at the optimum pH, and lower activity again as active-site shape is altered.]
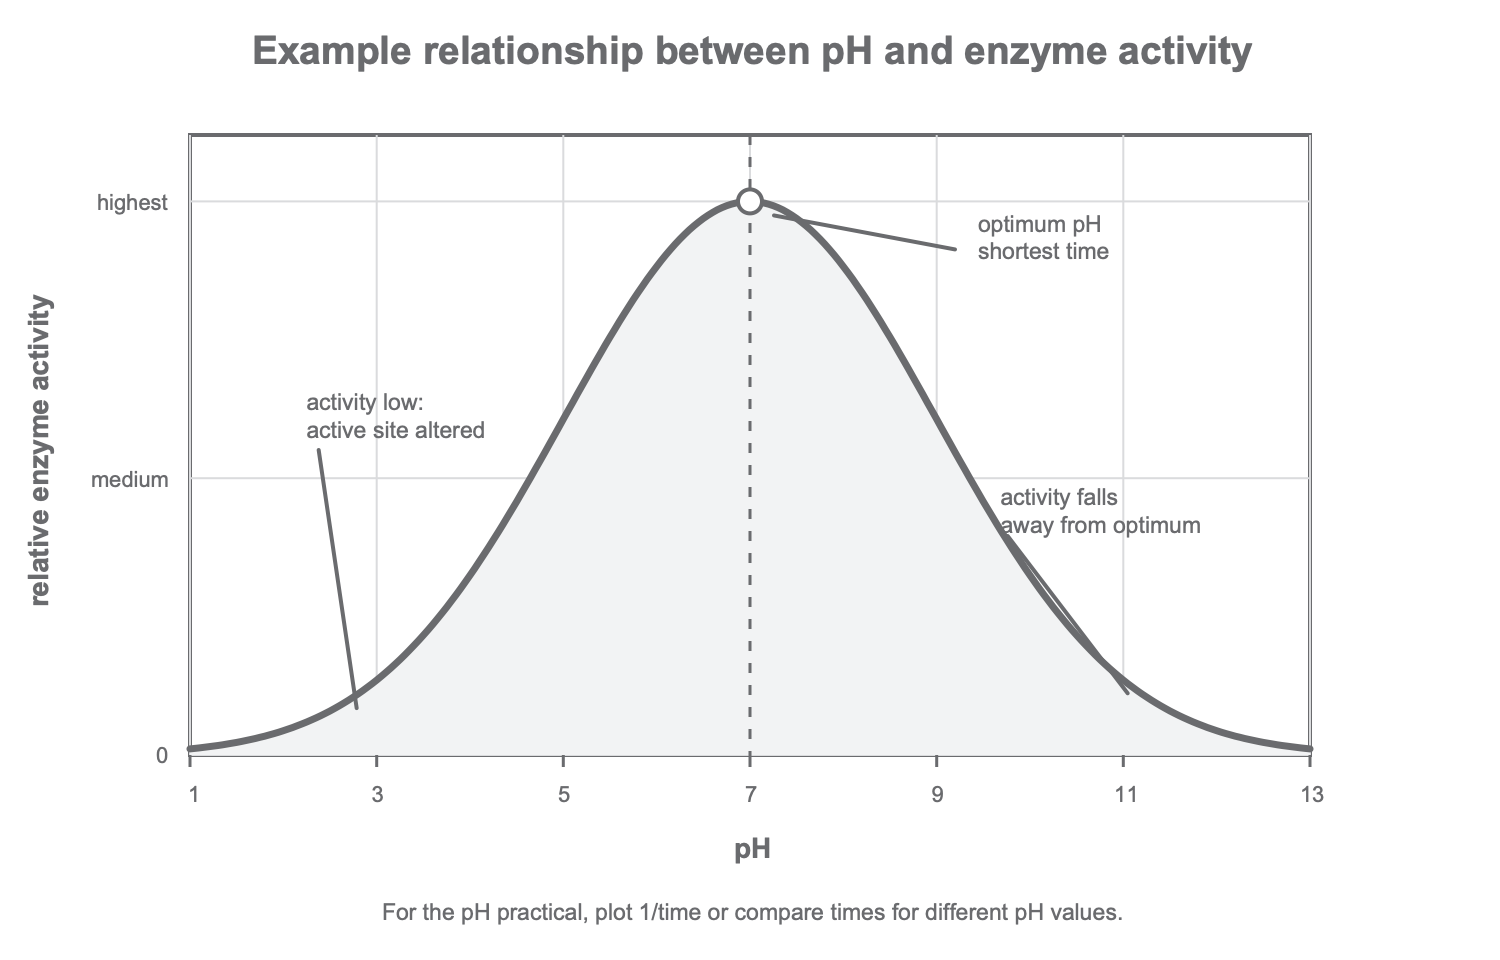
Results are usually clearer if the time values are converted into relative activity using 1/time. The fastest reaction has the shortest time and the highest relative activity.
For example, if one pH gives a time of 50 seconds and another gives a time of 200 seconds, the 50 second result shows higher enzyme activity. A graph of relative activity against pH normally rises to a peak at the optimum pH, then falls as the pH moves further away from the optimum.
Repeats make the results more reliable. Calculate a mean for each pH, but look for anomalous results before using the mean. If iodine still turns blue-black at the final sampling time, record that the reaction did not finish within the chosen time; do not pretend an exact end point was found.
Accuracy and validity depend on the method. The comparison is more valid if pH is the only variable deliberately changed. It is more accurate if volumes are measured with suitable apparatus, the water bath keeps temperature constant, and samples are taken at regular timed intervals.