2.9-2.12 - Current-voltage graphs and electrical components
Current-voltage graphs show how the current through a component changes when the voltage across it changes. Different components give different graph shapes, so the shape of the graph is evidence for how the component behaves in a circuit. In this lesson, the focus is qualitative: recognise the shapes, describe the investigation, and connect changes in resistance to changes in current.
What I-V graphs show
A current-voltage graph is often called an I-V graph because the symbol for current is and the symbol for voltage is .
Current-voltage graph
A current-voltage graph shows current on the vertical axis and voltage on the horizontal axis for one electrical component.
The graph is made from pairs of readings: the voltage across the component and the current through it. If a component allows a larger current for the same voltage, it has less opposition to the current. If a component allows a smaller current for the same voltage, it has more opposition to the current.
For a straight-line I-V graph through the origin, current is directly proportional to voltage. Doubling the voltage doubles the current. This is the shape expected for a wire or fixed resistor, provided its temperature stays constant.
On an I-V graph, do not treat the steepness as "the resistance" without thinking. A steeper I-V line means more current for the same voltage, so it means a lower resistance. A less steep I-V line means less current for the same voltage, so it means a higher resistance.
Investigating I-V characteristics
To investigate an I-V characteristic, the component must be in a circuit where both current and voltage can be measured. The ammeter is placed in series with the component, so it measures the current through the component. The voltmeter is connected in parallel across the component, so it measures the voltage across that component.
A suitable method is:
- Connect the component under test in series with an ammeter, a power supply and a way to vary the voltage, such as a variable power supply or variable resistor.
- Connect a voltmeter across the component.
- Set a small voltage and record the voltage and current.
- Increase the voltage in steps and record a pair of voltage-current readings each time.
- Keep within safe current limits, especially for lamps and diodes, and avoid touching a hot filament lamp.
- Reverse the connections to obtain readings for the opposite direction where this is useful.
- Plot current on the y-axis against voltage on the x-axis.
For a diode, a protective resistor is normally used in series so the current does not become too large when the diode conducts. For a filament lamp, the lamp gets hot during the investigation; that heating is part of why its graph is not a straight line.
Good practical answers say what is measured, how the voltage is changed, what is kept safe, and how the graph is plotted. They do not just say "connect a circuit and take readings".
Resistor, lamp and diode graphs
[DIAGRAM: asset_name: Current-voltage graphs and electrical components - diagram 01; asset_slug: p16_current_voltage_graphs_and_electrical_components__diagram_01; recommended_method: matplotlib; description: Monochrome 16:9 set of three qualitative I-V graphs with current on the vertical axis and voltage on the horizontal axis. Show a wire or fixed resistor as a straight line through the origin, a metal filament lamp as a symmetric curve that flattens as the filament heats, and a diode with little reverse current and a sharply rising forward current.]
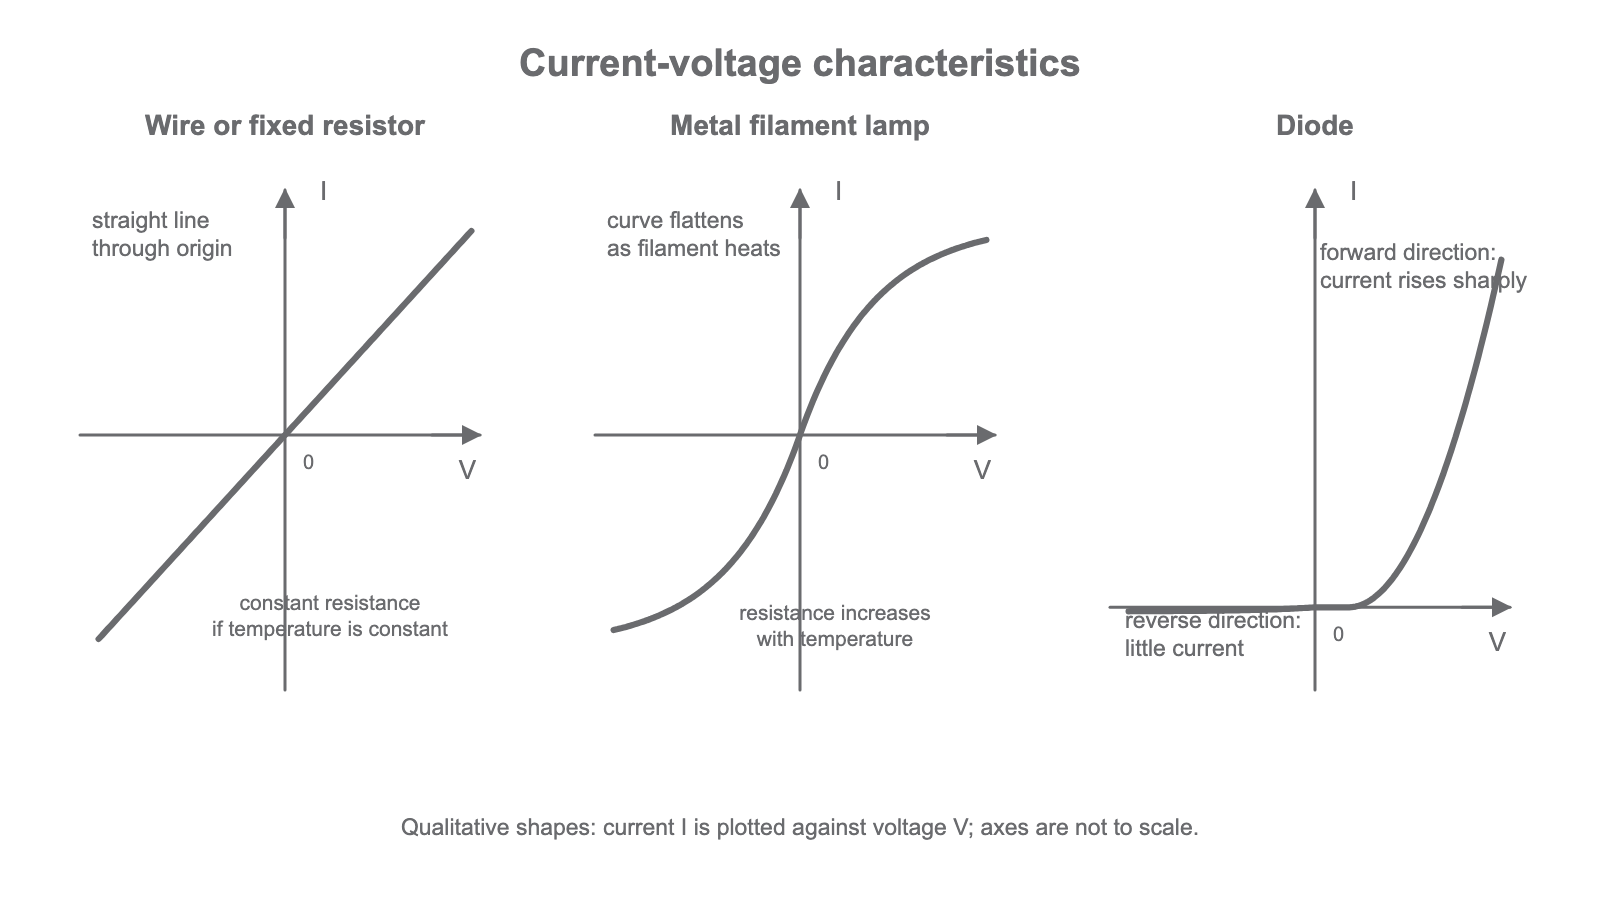
A wire or fixed resistor has a straight-line graph through the origin if its temperature is constant. The current increases in direct proportion to the voltage.
A metal filament lamp does not have a straight-line graph. As the current increases, the filament gets hotter. The hotter filament has a greater resistance, so the current increases more slowly as the voltage is increased. This gives a curved graph that becomes less steep at higher voltages.
A diode allows current much more easily in one direction than the other. In the reverse direction there is little or no current. In the forward direction the current is small until the diode starts conducting, then the current increases sharply.
The graph shape is the important evidence. If an exam question describes a straight line through the origin, think wire or fixed resistor. If the graph curves and becomes less steep on both sides, think filament lamp. If current is mainly in one direction, think diode.
Changing resistance changes current
Resistance is opposition to current. In a circuit with the same supply voltage, increasing the resistance decreases the current. Decreasing the resistance increases the current.
This is a qualitative idea in this lesson. You do not need to calculate a resistance value here; you need to describe the direction of the change.
For example, if a variable resistor is adjusted to give a larger resistance, there is more opposition to the flow of charge. The current in the circuit becomes smaller. If it is adjusted to give a smaller resistance, there is less opposition, so the current becomes larger.
The phrase "current takes the easiest path" can be misleading. A safer exam answer is: for the same supply voltage, lower resistance gives a larger current and higher resistance gives a smaller current.
LDRs and thermistors
Some resistors change resistance when their surroundings change. In this lesson, the two required examples are light-dependent resistors and thermistors.
An LDR is a light-dependent resistor. Its resistance decreases when illumination increases. In brighter light, an LDR has a lower resistance; in dimmer light, it has a higher resistance. For the same supply voltage, brighter light would therefore allow a larger current in a simple series circuit containing the LDR.
A thermistor is a resistor whose resistance changes with temperature. At this level, the thermistor trend to know is: as temperature increases, resistance decreases. For the same supply voltage, heating the thermistor would therefore allow a larger current in a simple series circuit containing the thermistor.
[DIAGRAM: asset_name: Current-voltage graphs and electrical components - diagram 02; asset_slug: p16_current_voltage_graphs_and_electrical_components__diagram_02; recommended_method: matplotlib; description: Monochrome 16:9 pair of qualitative trend graphs. First graph: LDR resistance on vertical axis decreases as illumination on horizontal axis increases. Second graph: thermistor resistance on vertical axis decreases as temperature on horizontal axis increases. Include simple arrows showing more light and hotter both lead to resistance falling.]
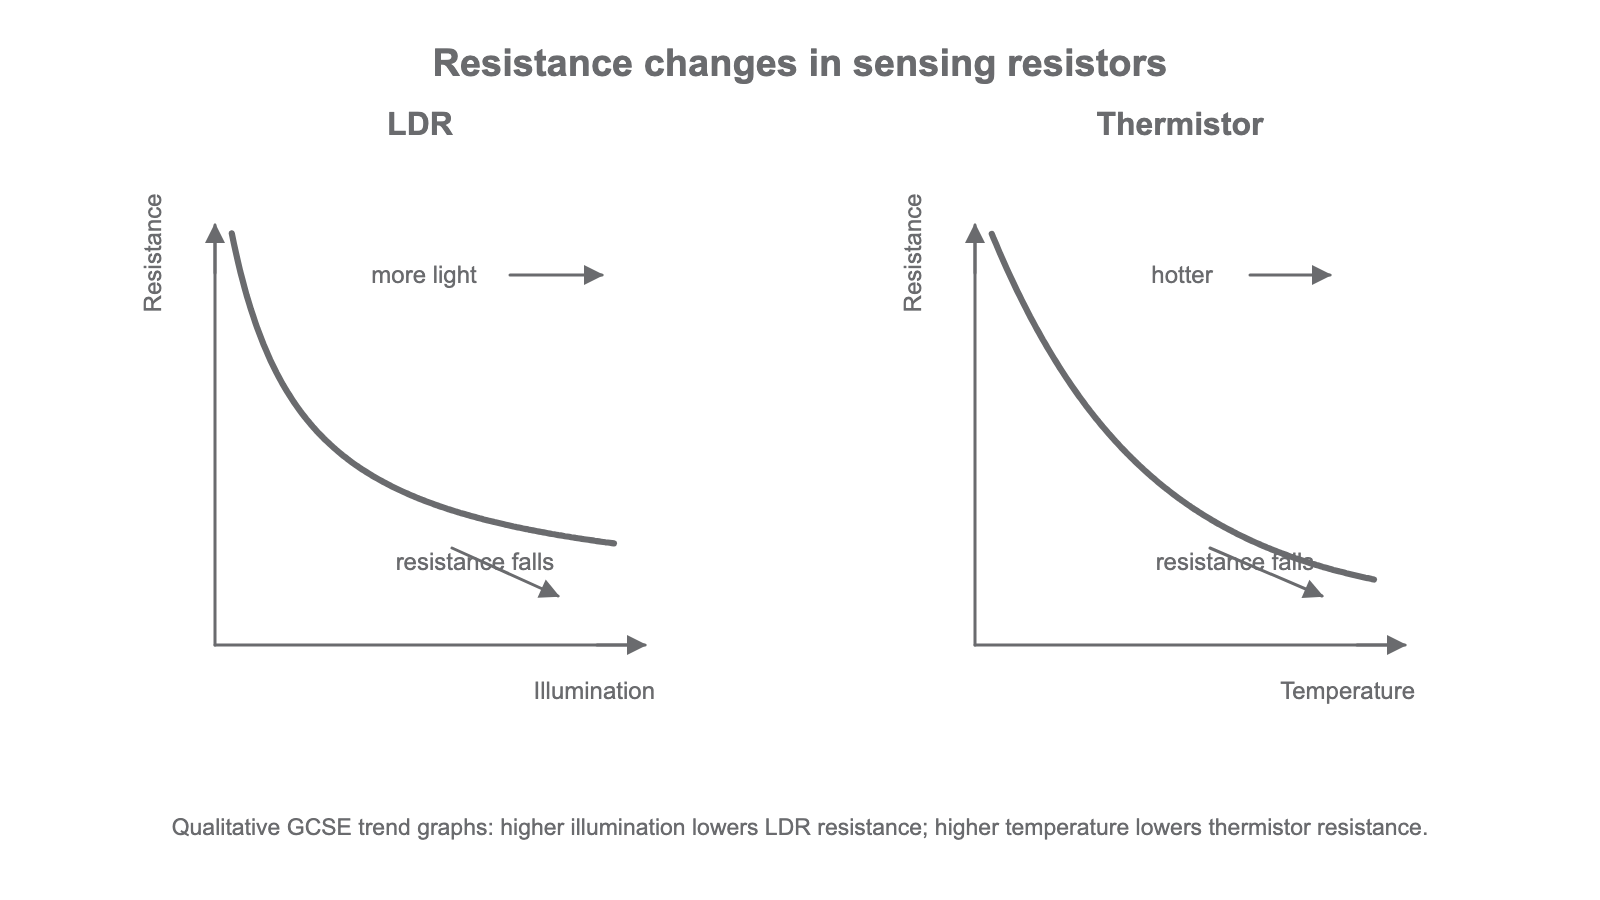
The common mistake is to reverse the trend. Use the input first, then the resistance, then the current: more light means lower LDR resistance, so current increases; higher temperature means lower thermistor resistance, so current increases.
Lamps and LEDs as current indicators
A lamp can indicate that there is a current in a circuit because it lights when enough current passes through it. If the circuit is broken, or if the current is too small, the lamp will not light or will be very dim.
An LED is a light-emitting diode. It can also indicate the presence of a current because it emits light when current passes through it in the correct direction. Since an LED is a diode, it is directional: if it is connected the wrong way round in a simple circuit, it may not conduct and will not light.
Lamps and LEDs are useful indicators, but they are not precise ammeters. A glowing lamp or LED tells you that current is present; it does not by itself give an accurate current value.