1.6-1.9 - Acceleration and velocity-time graphs
Velocity-time graphs are one of the quickest ways to describe motion because they show both how fast an object is moving and how that motion is changing. In this lesson, you will use the acceleration equation, explain the shape of a velocity-time graph, find acceleration from its gradient, and find distance travelled from the area under the graph.
Acceleration from changing velocity
Acceleration tells you how quickly velocity changes. If an object's velocity changes a lot in a short time, its acceleration is large. If the velocity does not change, the acceleration is zero.
Acceleration
Acceleration is the change in velocity per unit time.
The Edexcel relationship uses u for initial velocity and v for final velocity. The change in velocity is final velocity minus initial velocity, so the order matters.
Acceleration
In this equation, a is acceleration in m/s^2, v is final velocity in m/s, u is initial velocity in m/s, and t is time taken in s.
The unit m/s^2 means "metres per second per second". For example, an acceleration of 3 m/s^2 means the velocity changes by 3 m/s every second.
Worked example
A car's velocity changes from 6 m/s to 18 m/s in 4.0 s.
The acceleration is 3.0 m/s^2.
If the final velocity is smaller than the initial velocity, the value of v - u is negative. A negative acceleration means the velocity is decreasing in the chosen direction. It is often called deceleration in everyday wording.
Plotting and explaining velocity-time graphs
A velocity-time graph has time on the horizontal axis and velocity on the vertical axis. The axes must be labelled with quantities and units, usually time / s and velocity / m/s.
To plot a velocity-time graph from data, plot each pair of values as a point. If the velocity changes steadily between the points, join them with straight line sections. If the velocity changes unevenly, a curve may be more appropriate, but the key idea is still the same: the graph is showing velocity at each time.
[DIAGRAM: velocity_time_graph_sections: Acceleration and velocity-time graphs - diagram 01; asset_slug: p03_acceleration_and_velocity_time_graphs__diagram_01; recommended_method: matplotlib; description: Monochrome 16:9 velocity-time graph with time on x-axis and velocity on y-axis. The line rises from 0 to 12 m/s over 0-4 s, remains horizontal from 4-7 s, then falls to 0 over 7-10 s. Label the sections accelerating, constant velocity, and decelerating; show a small gradient triangle on the first section. Use #6A6B6E on white.]
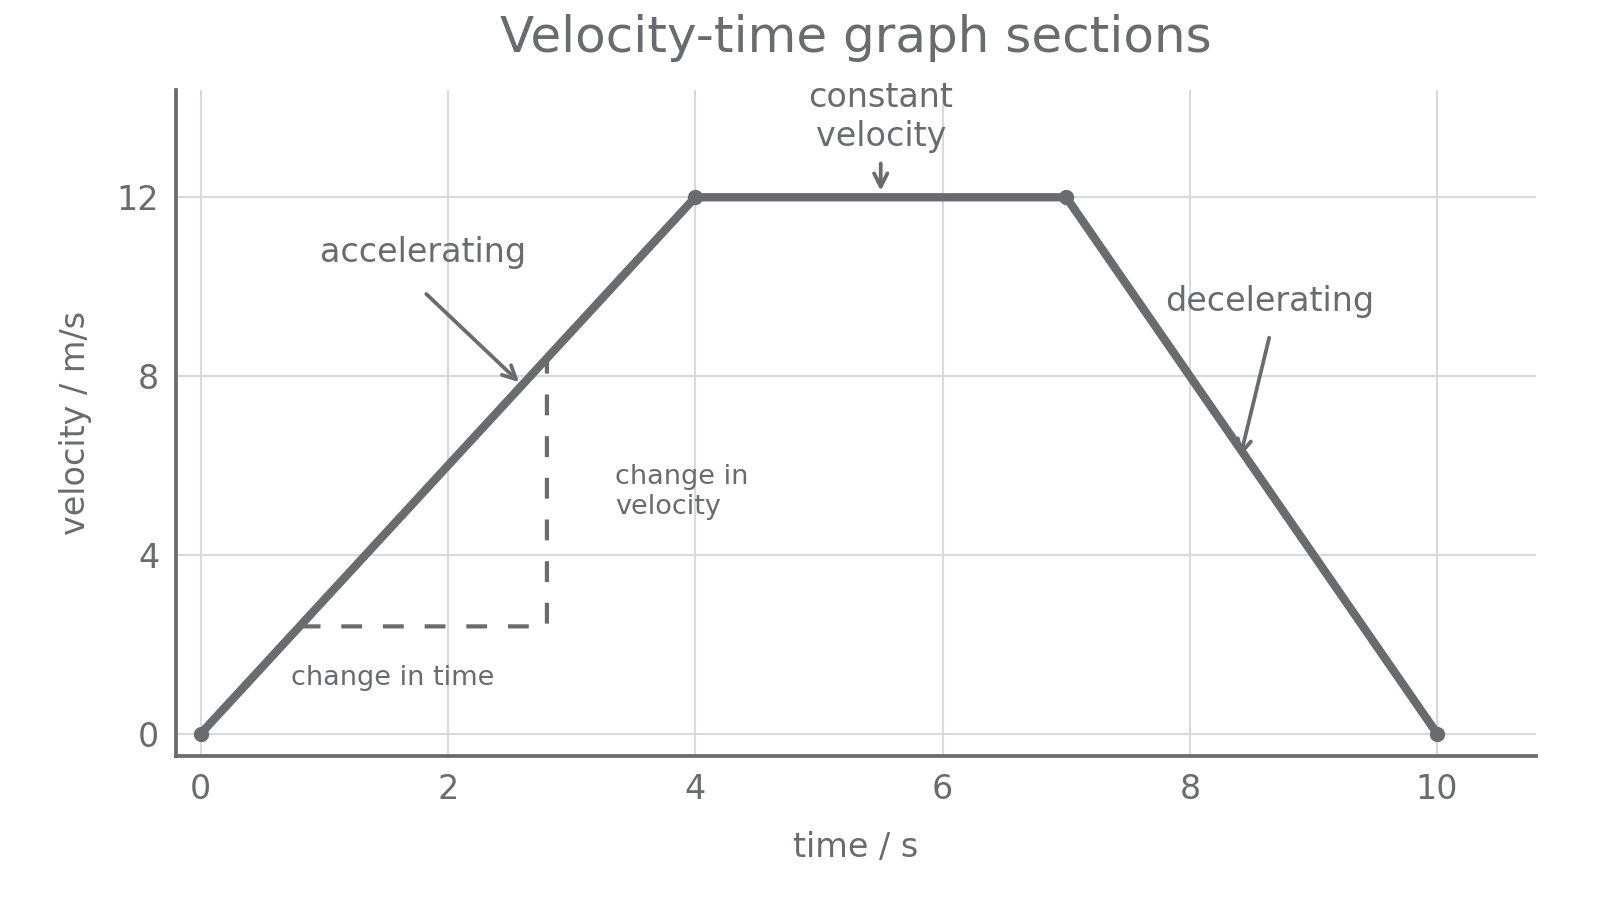
The shape of the graph tells you what the object is doing:
- a horizontal line means constant velocity
- a straight line sloping upwards means constant positive acceleration
- a straight line sloping downwards means the velocity is decreasing
- a steeper sloping line means a larger acceleration or deceleration
- a line on the time axis means zero velocity
In an explanation, link the graph feature to the motion. For example, "the line is horizontal, so the velocity is constant" is better than just saying "it is flat".
Gradient gives acceleration
The gradient of a velocity-time graph is acceleration. This is because the gradient calculation is the same as the acceleration calculation:
For a straight section, choose two clear points on the line. Use their velocities and times to calculate:
The units also confirm the meaning: (m/s) / s = m/s^2.
Worked example
On the first section of the diagram, the velocity increases from 0 m/s at 0 s to 12 m/s at 4 s.
The middle section is horizontal, so its gradient is zero and its acceleration is 0 m/s^2.
The last section falls from 12 m/s at 7 s to 0 m/s at 10 s.
The negative sign means the velocity is decreasing in the chosen direction.
Area gives distance travelled
The distance travelled is found from the area between a velocity-time graph and the time axis. This works because velocity multiplied by time gives distance:
For simple straight-line velocity-time graphs, split the area into rectangles and triangles. Use the usual area formulae:
- rectangle area = base x height
- triangle area =
1/2 x base x height
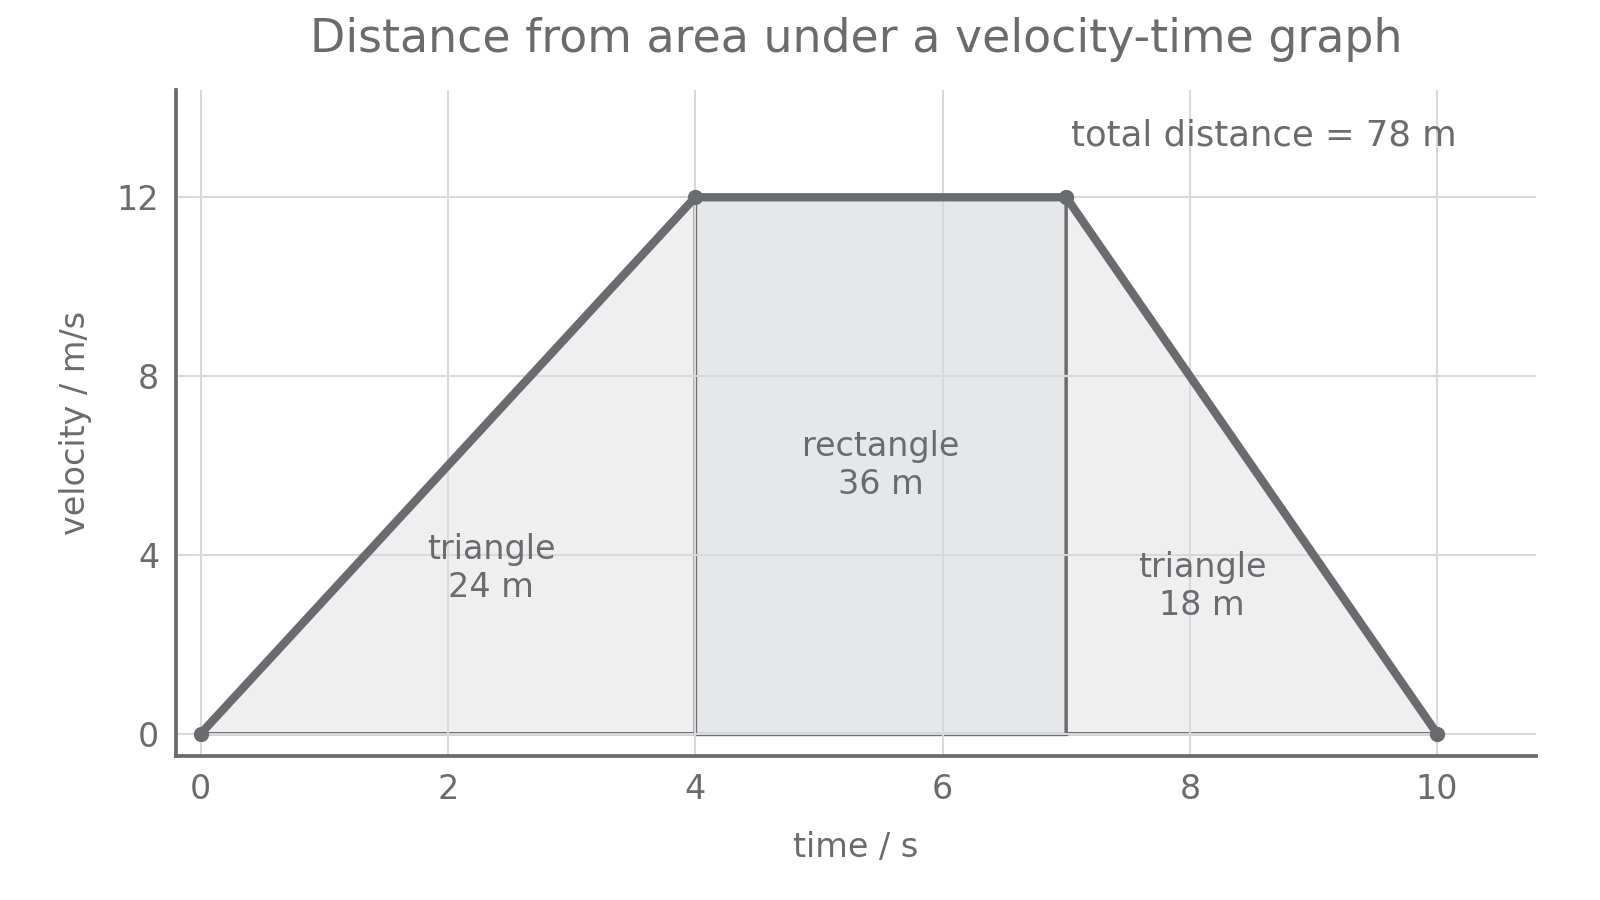
[DIAGRAM: area_under_velocity_time_graph: Acceleration and velocity-time graphs - diagram 02; asset_slug: p03_acceleration_and_velocity_time_graphs__diagram_02; recommended_method: matplotlib; description: Monochrome 16:9 velocity-time graph with the same data as diagram 01; shade the area between the line and the time axis in three pale grey regions labelled triangle 24 m, rectangle 36 m, triangle 18 m; include total distance = 78 m. Use #6A6B6E on white.]
Worked example
In the area diagram:
- from
0 sto4 s, the area is a triangle:1/2 x 4 x 12 = 24 m - from
4 sto7 s, the area is a rectangle:3 x 12 = 36 m - from
7 sto10 s, the area is a triangle:1/2 x 3 x 12 = 18 m
Total distance travelled:
When a question says "determine the distance travelled", show enough working for the examiner to see which areas you used.
Choosing gradient or area
Velocity-time graph questions often use the same graph for several different quantities. The skill is deciding what the question is asking for before you start calculating.
Use the vertical value to read a velocity at a particular time. Use the gradient to determine acceleration. Use the area between the graph and the time axis to determine distance travelled.
Worked example
A toy car travels at 4 m/s at 0 s. Its velocity increases in a straight line to 14 m/s at 5 s, then it travels at 14 m/s until 8 s.
To determine acceleration from 0 s to 5 s:
To determine distance from 0 s to 8 s, split the area into familiar shapes.
From 0 s to 5 s, use a rectangle plus a triangle:
From 5 s to 8 s, use a rectangle:
Total distance:
Common mistakes are using area when the question asks for acceleration, using gradient when the question asks for distance, forgetting the unit, or calculating the area of only one section when the graph has several sections.