1.8-1.10 - Mass Spectrometry For Relative Mass
This lesson covers spec points 1.8, 1.9 and 1.10: using mass-spectrometry data to calculate relative atomic mass from isotope abundance, working backwards from relative atomic mass to isotope abundance, predicting diatomic molecule spectra, and using the molecular ion peak to find relative molecular mass. The definitions of isotope and relative mass belong to the previous lesson, so here they are used as working tools rather than retaught from scratch. Successive ionisation energy is deliberately left to the next lesson; in this lesson, the ionisation idea matters only because a mass spectrometer detects ions by their mass-to-charge ratio.
The problem
A sample of an element gives two peaks in a mass spectrum:
| m/z | Relative peak height |
|---|---|
| 35 | 75 |
| 37 | 25 |
The instrument is not saying that one atom has a mass of 35.5. It is saying that two kinds of atom are present, and their ions are detected at different m/z values.
What the instrument data means
For the AS part of Edexcel 9CH0, treat these isotope peaks like this:
- each peak represents ions of one isotope
m/zis mass-to-charge ratio- for singly charged ions,
m/zhas the same numerical value as the isotope mass used in the calculation - peak height or peak area represents relative abundance
So a peak at m/z = 35 with height 75 means that isotope-35 contributes 75 relative parts to the sample. A peak at m/z = 37 with height 25 means isotope-37 contributes 25 relative parts. The relative atomic mass is the weighted mean of those isotope masses, not the middle of the two masses.
The general route is:
relative atomic mass = sum(isotope mass x relative abundance) / sum(relative abundance)
If the abundances are percentages, the denominator is 100. If the spectrum gives relative peak heights such as 100 and 32, the denominator is 100 + 32, not automatically 100.
Feynman diagnostic
Explain this to a younger student: "A relative atomic mass can be a decimal even though each atom in the sample has a whole-number mass number."
A strong explanation says that the decimal is an average for a large mixture of isotopes. It does not mean the individual atoms have fractional numbers of protons or neutrons.
Worked example: magnesium isotope data
A sample of magnesium contains three isotopes.
| Isotope | Mass used in calculation | Relative abundance / % |
|---|---|---|
| ^24Mg | 24 | 78.99 |
| ^25Mg | 25 | 10.00 |
| ^26Mg | 26 | 11.01 |
Calculate the relative atomic mass of magnesium from these data.
The chemical model is a weighted mean: the most abundant isotope should pull the answer closest to its mass. Here ^24Mg is much more common than the other two, so the answer should be just above 24, not near 25.
Ar = [(24 x 78.99) + (25 x 10.00) + (26 x 11.01)] / 100
Ar = (1895.76 + 250.00 + 286.26) / 100
Ar = 2432.02 / 100
Ar = 24.3202
To a sensible number of significant figures:
Ar(Mg) = 24.32
The sense check matters. The answer is close to 24 because almost 79% of the atoms are ^24Mg.
Same calculation from peak heights
A mass spectrum of element X has these isotope peaks:
| m/z | Relative peak height |
|---|---|
| 10 | 19.9 |
| 11 | 80.1 |
The heights happen to sum to 100, so the calculation is:
Ar = [(10 x 19.9) + (11 x 80.1)] / 100
Ar = (199.0 + 881.1) / 100
Ar = 10.801
If the heights had been 50 and 201 instead, the chemical mixture would be similar, but the denominator would be 251.
Active check
Finding Abundance From Relative Atomic Mass
Sometimes the relative atomic mass is known and the isotope abundances are unknown. The model is still the weighted mean, but one abundance becomes the unknown.
Worked example: two isotopes
Element Y has two isotopes, ^10Y and ^11Y. Its relative atomic mass is 10.81. Calculate the percentage abundance of each isotope.
Let the percentage abundance of ^10Y be x.
Then the percentage abundance of ^11Y is 100 - x.
Use the weighted mean:
10.81 = [10x + 11(100 - x)] / 100
Multiply by 100:
1081 = 10x + 1100 - 11x
1081 = 1100 - x
x = 19
So:
^10Y = 19%
^11Y = 81%
This is chemically sensible because the relative atomic mass, 10.81, is much closer to 11 than to 10, so the isotope with mass 11 must be more abundant.
Common-error contrast
Tempting but wrong: "10.81 is 81% of the way from 10 to 11, so ^10Y is 81%."
Correct: being 81% of the way towards mass 11 means the heavier isotope is 81% abundant. The average moves towards the isotope that is more common.
Active check
Predicting Diatomic Molecule Spectra
Diatomic molecules create a new layer of reasoning because each molecule contains two atoms. The mass peak for the molecule depends on the isotope combination inside that molecule.
The chlorine pattern
Chlorine has two main isotopes, approximately in a 3 : 1 abundance ratio:
^35Cl : ^37Cl = 3 : 1
So the probabilities are:
P(^35Cl) = 3/4
P(^37Cl) = 1/4
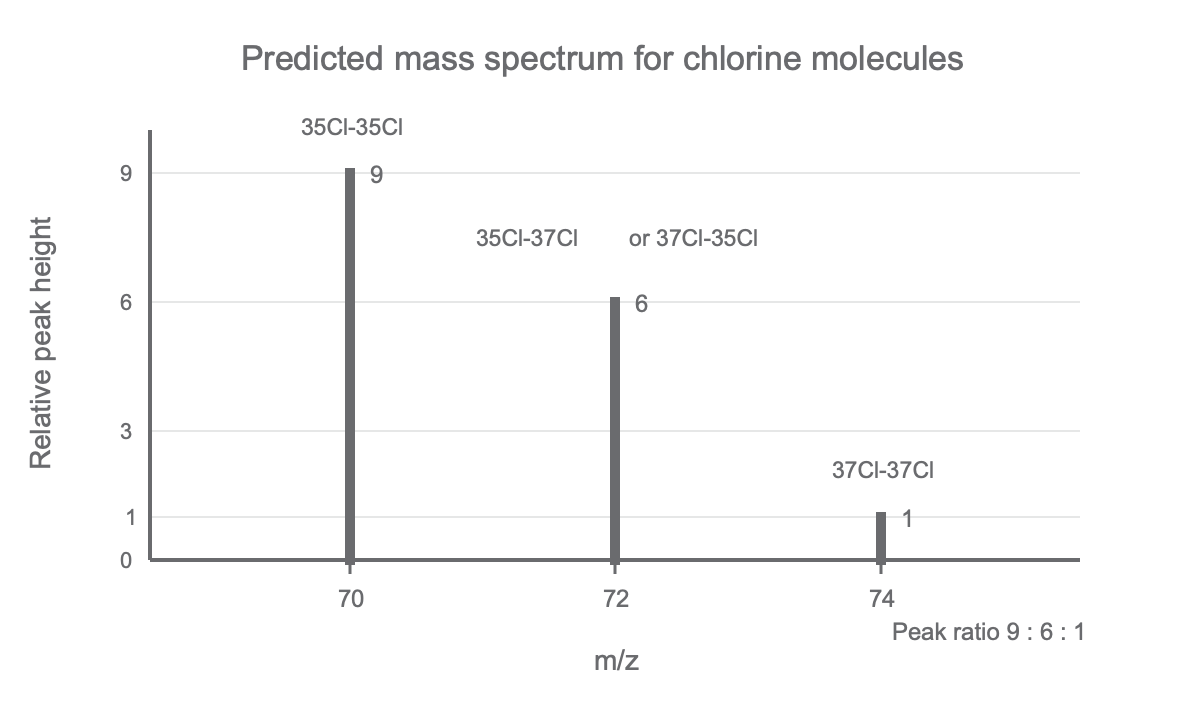
For chlorine molecules, there are three possible masses:
| Molecule ion | m/z for singly charged ion | Probability route | Relative peak height |
|---|---|---|---|
| ^35Cl-^35Cl | 70 | (3/4) x (3/4) | 9 |
| ^35Cl-^37Cl or ^37Cl-^35Cl | 72 | 2 x (3/4) x (1/4) | 6 |
| ^37Cl-^37Cl | 74 | (1/4) x (1/4) | 1 |
The middle peak is doubled because there are two ways to make a mixed molecule: the lighter isotope can be first or second. The instrument does not care about order, so both mixed combinations contribute to the same m/z = 72 peak.
Therefore the predicted molecular-ion peak pattern for Cl2 is:
m/z 70 : 72 : 74 = 9 : 6 : 1
Guided practice: bromine-like equal abundances
Suppose element E has two isotopes, ^79E and ^81E, in a 1 : 1 ratio. Predict the three molecular ion peaks for E2.
Masses:
79 + 79 = 158
79 + 81 = 160
81 + 81 = 162
Probabilities:
P(79-79) = 1/2 x 1/2 = 1/4
P(79-81 or 81-79) = 2 x 1/2 x 1/2 = 1/2
P(81-81) = 1/2 x 1/2 = 1/4
So the peak-height ratio is:
m/z 158 : 160 : 162 = 1 : 2 : 1
Active check
Feynman diagnostic
Explain why the Cl2 peak at m/z = 72 is not evidence for a chlorine isotope with mass 36.
A strong explanation says that m/z = 72 comes from one ^35Cl atom plus one ^37Cl atom in the same molecule. The peak belongs to a molecule ion, not to a single chlorine atom.
[DIAGRAM: asset_name: Chlorine Molecule Mass Spectrum; asset_slug: edexcel_a_level_chemistry_l003_chlorine_molecule_mass_spectrum; recommended_method: matplotlib; description: Predicted mass spectrum for chlorine molecules, showing m/z 70, 72 and 74 peaks with relative peak heights 9, 6 and 1.]
Using The Molecular Ion Peak
Mass spectrometry can also give the relative molecular mass of a molecule. In this part of the specification, the allowed reasoning is deliberately narrow: use the m/z value for the molecular ion, M+, to find Mr.
What M+ means
When a molecule is ionised but stays in one piece, it forms the molecular ion:
M(g) -> M+(g) + e-
For a singly charged molecular ion:
m/z of M+ = relative molecular mass
So if the molecular ion peak is at m/z = 46, the molecule has:
Mr = 46
This does not by itself prove the full structure of the molecule. Many different molecules can have the same relative molecular mass. Fragment patterns and high-resolution mass spectrometry are later analytical tools; here the Edexcel boundary is the molecular ion peak giving relative molecular mass.
Worked example: do not confuse M+ with the base peak
A mass spectrum has major peaks at:
| m/z | Relative intensity |
|---|---|
| 15 | 40 |
| 29 | 100 |
| 46 | 28 |
The peak at m/z = 29 is the base peak because it is the tallest. The molecular ion peak is stated or identified as M+ at m/z = 46.
Therefore:
Mr = 46
The base peak is useful in later organic mass spectrometry because it tells chemists about a stable fragment. For this lesson, the mark-earning statement is simply that the M+ peak gives the relative molecular mass.
Active check
Final Pearson-style recap
For rows 1.8-1.10, the reasoning chain is compact but very assessable:
- To calculate
Ar, use a weighted mean: isotope mass multiplied by relative abundance, divided by total abundance. - To find abundance from
Ar, set up the same weighted mean with one abundance as the unknown. - To predict a diatomic molecule spectrum, add isotope masses and use probability to get relative peak heights.
- To find
Mrfrom mass spectrometry in this AS context, use them/zvalue of the molecular ion,M+.
Pearson command words usually reward the visible route. For calculate, show the weighted mean and denominator. For predict, show both the possible masses and the relative peak-height logic. For determine, identify the molecular ion peak before giving Mr.