5.2, 5.2.3 - Party coalitions and voting patterns
Section 5.2 concerns the parties; 5.2.3 asks how race, religion, gender and education influence their coalitions of supporters. Use the 2024 presidential campaign as the recent case study, distinguishing an observed voting pattern from an explanation of why it occurred. These are tendencies within groups, not rules predicting every individual's vote.
Coalitions and voting evidence
A party's coalition of supporters consists of groups and individuals whose different priorities bring them behind the same candidate. One voter may support a party for its economic programme, another for a moral issue, and a third because they dislike the alternative. A coalition is therefore broader than an ideological faction inside the party.
Voting pattern
A regularity in how a defined group votes. It describes a distribution of choices, not a necessary relationship between social identity and political belief.
Three quantities must be distinguished. Vote choice within a group asks what percentage of that group's voters supported a candidate. The composition of a candidate's coalition asks what percentage of the candidate's supporters belonged to that group. Turnout asks what percentage of eligible people actually voted. A small group can be highly loyal but supply fewer votes than a much larger, less loyal group.
Consider an original numerical example. If 90 of 100 voters in Group A back a candidate, the candidate has 90% support within A. If the candidate receives 1,000 votes overall, those 90 represent only 9% of the candidate's coalition. The percentages have different denominators and cannot be substituted for one another. Nor does either tell us how many eligible members of A stayed home.
Official election results identify the votes counted for candidates, but the secret ballot does not attach each choice to the voter's religion or education. Those characteristics require survey evidence. This lesson uses Pew Research Center's 26 June 2025 validated-voter study: turnout was checked against voting records, while candidate choice was self-reported. These are estimates with sampling and reporting limits, not an official demographic count of every ballot.
The election process and incumbency mechanisms are taught in 5.1, 5.1.1 - Presidential and congressional elections. Here the question is who supported the candidates and why; the governing party's performance and the rival candidate can affect several demographic groups simultaneously.
Race and the 2024 coalitions
Race and ethnicity can be connected to political experience, community networks and perceptions of representation, rather than automatically causing one vote choice. Experiences of discrimination or exclusion may make civil-rights commitments salient; economic interests, local context and views of the candidates may pull in another direction. To explain a pattern, identify how a political issue or loyalty could link the group's experience to its electoral choice.
Pew's 2024 estimates put Trump's support at 55% among White voters, 15% among Black voters, 48% among Hispanic voters and 40% among Asian voters. These categories describe the study's groups. The chart deliberately uses one candidate's share within each group so that its denominator remains clear.
[DIAGRAM: asset_slug: s26-race-vote-2024; description: Estimated share of each racial or ethnic voter group supporting Trump in 2024, with an exact 0 to 100 percent scale]
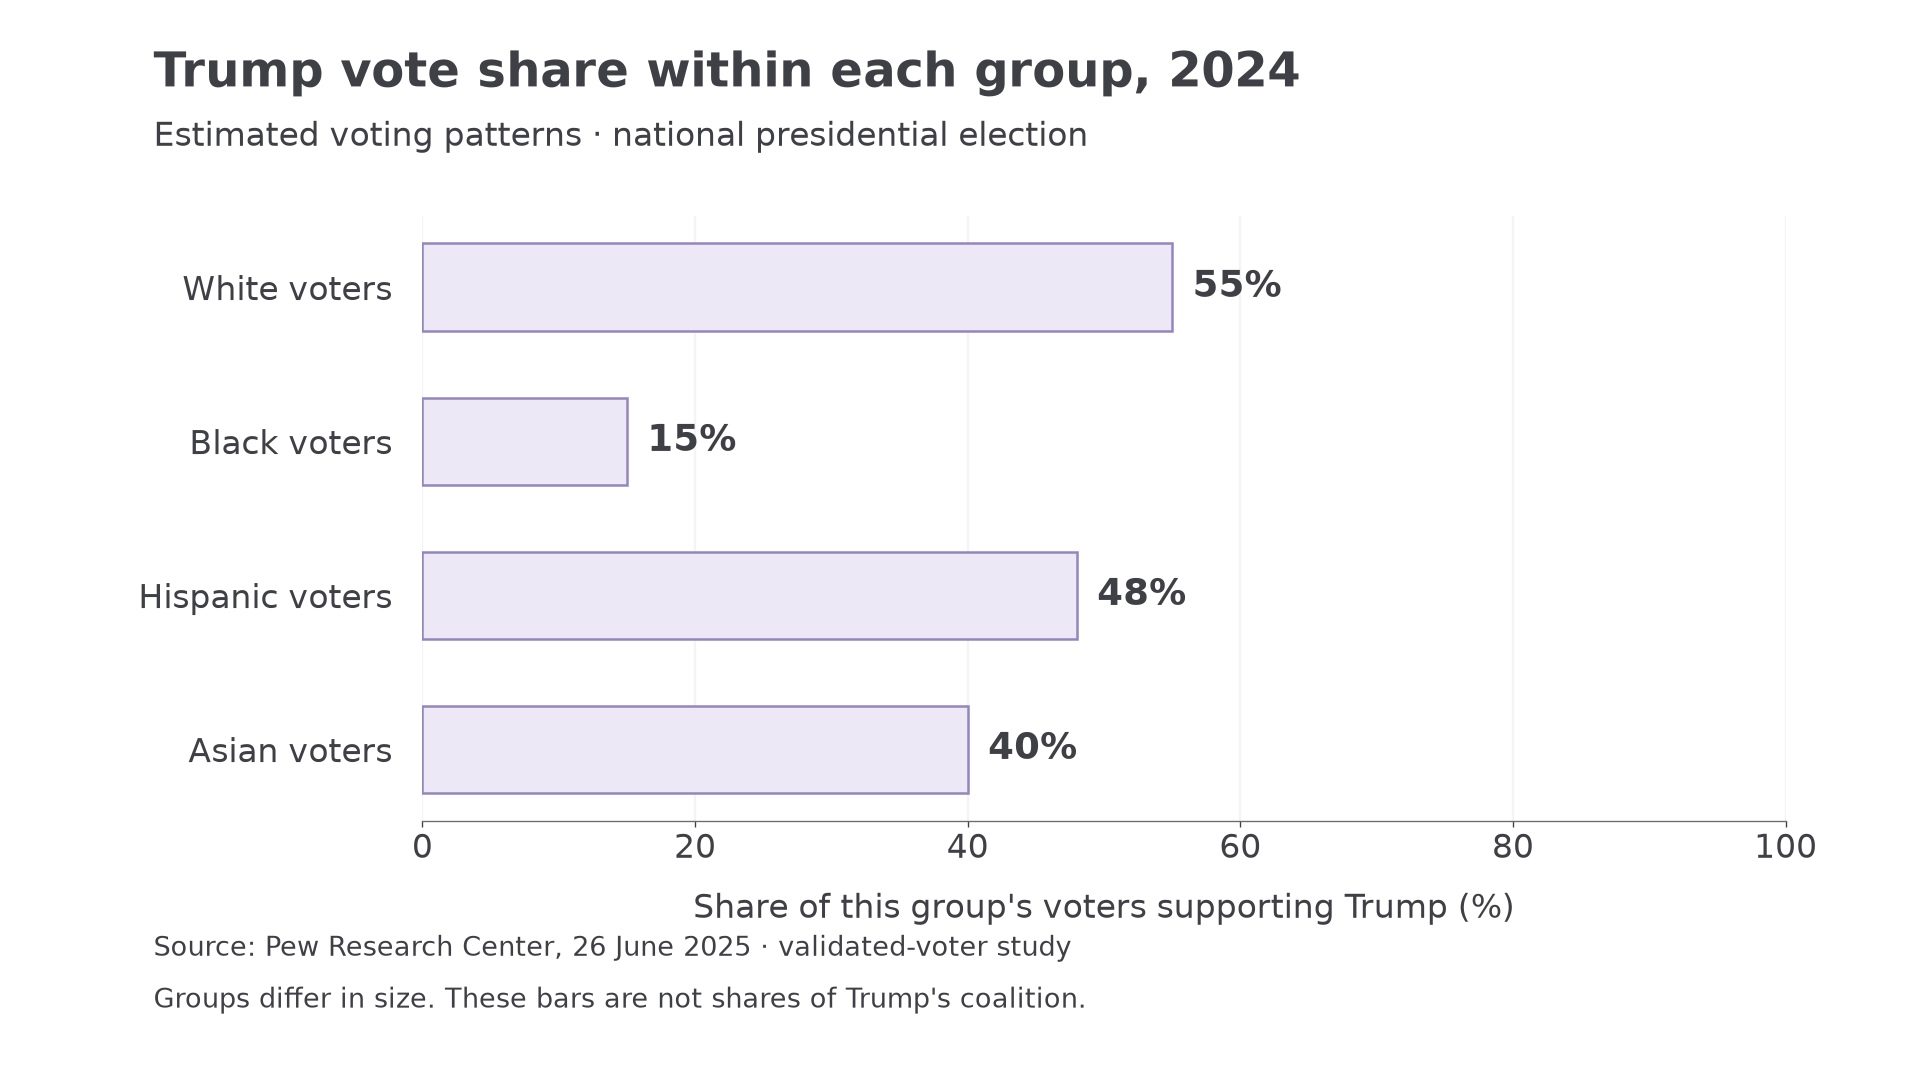
Trump's estimated 2024 vote share within four voter groups. A bar describes support within that group, not its size in the electorate or Trump's coalition.
The Black electorate remained an important Democratic coalition, but the Republican share shows that it was not unanimous. The close Hispanic division also challenges the assumption that all ethnic-minority groups form one identical Democratic bloc. Categories such as Hispanic include people with different national origins, incomes, regions and political histories. A national estimate cannot resolve every local subgroup.
One plausible explanation of Democratic support is that voters associate the party with civil-rights protection and more active government against exclusion. One plausible route to Republican support is greater priority for economic dissatisfaction, conservative social values or the candidate's leadership claim. These are analytical hypotheses informed by the policy positions taught in the preceding lesson. The chart itself establishes a pattern; it cannot establish which motivation caused each voter to choose a candidate.
Do not attribute an apparent change entirely to people switching party. The electorate can change because different people turn out. Comparing aggregate percentages alone cannot distinguish persuasion from mobilisation or abstention; that requires evidence following individuals or measuring turnout.
Religion and political priorities
Religion can influence voting through moral beliefs, community ties and the importance attached to particular policies. Religious organisations and activist networks can supply political messages and mobilisation, although an individual's religious affiliation does not establish that they followed any organisation's advice.
In the 2024 study, 81% of White evangelical Protestant voters supported Trump; 70% of religiously unaffiliated voters supported Harris. The contrasting denominators refer to particular groups, not “all Christians” and “all Democrats.” They suggest coalitions with different priorities rather than a division between religious people and people who cannot hold moral beliefs.
Continue this lesson.
You’re previewing NovaLearn without an account. Create a free account to read the rest.
Create free account