4.1 - Comparing voting patterns across three elections
The same social characteristic can be associated with different votes in different elections. Compare 1979, 1997 and 2024 to explain changes and continuities in class, party attachment, gender, age, ethnicity, region and participation. You will also learn why national data need consistent definitions before they can support a political argument.
Results and participation on comparable measures
All three elections changed the governing party, but the winning coalitions and the relationship between votes and power differed. The table separates exact election results from the demographic survey estimates used later.
| Measure | 1979 | 1997 | 2024 |
|---|---|---|---|
| Winning party | Conservative | Labour | Labour |
| Winner's UK vote share | 43.9% | 43.2% | 33.7% |
| Winner's seats / total | 339 / 635 | 418 / 659 | 411 / 650 |
| Winner's seat share, rounded | 53.4% | 63.4% | 63.2% |
| UK turnout: valid votes / registered electorate | 76.0% | 71.4% | 59.7% |
Sources: Commons historical statistics, 2024 results and 2024 turnout; checked 14 October 2026. Parliamentary classifications sometimes treat the Speaker separately. The table follows the stated Commons party seat totals, avoiding a mixture of conventions.
[DIAGRAM: asset_slug: election-results-comparison; description: Winning party vote and Commons seat shares, with UK turnout, for 1979, 1997 and 2024]
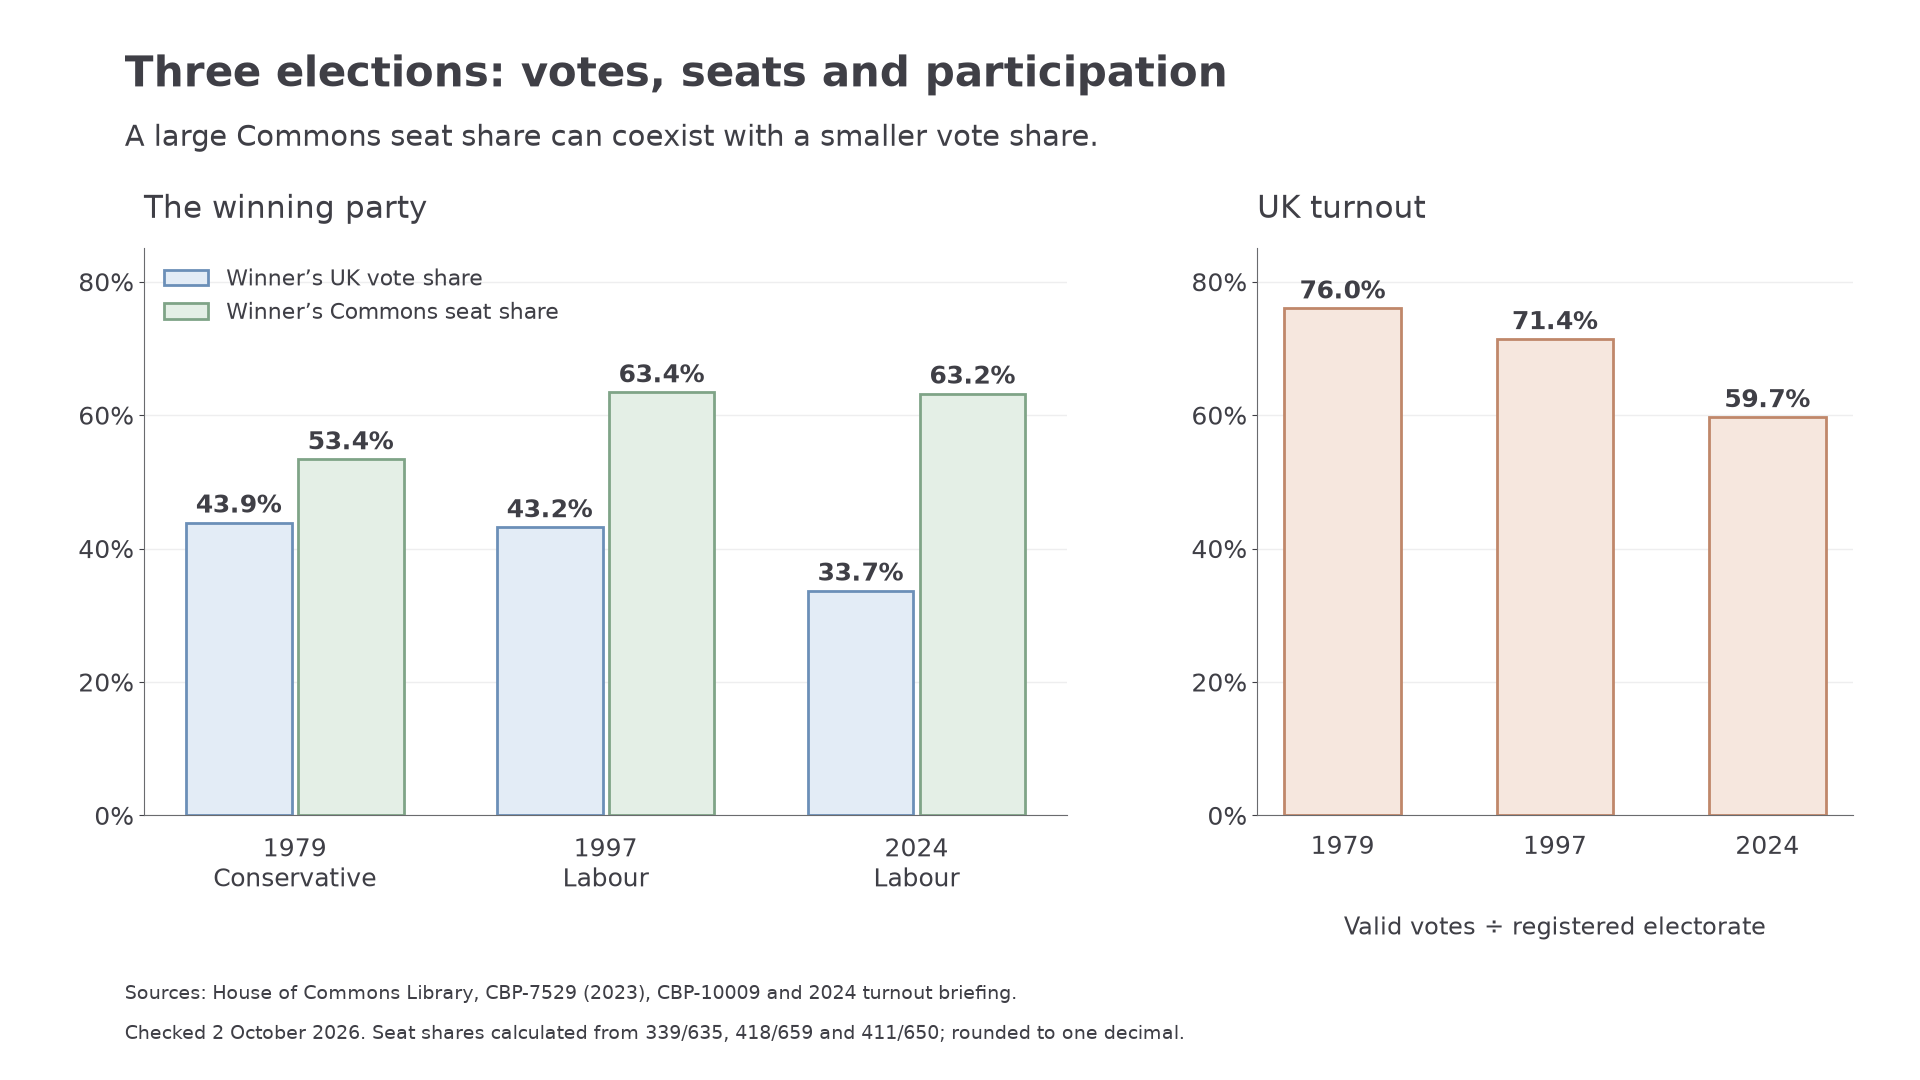
Winning party vote and seat shares use different denominators. Turnout uses valid votes divided by the registered electorate; the chart keeps participation separate from party support.
The chart shows why a landslide must be defined carefully. Labour's 2024 seat share resembled 1997, while its vote share was substantially lower. First past the post translates constituency first places into seats; competition from several parties can help a winner secure many seats without a national majority of votes. This affects a mandate, the winner's claim to authority to implement its programme, but does not invalidate its legal right to form a government.
Participation fell across these three selected cases, but this is not evidence of an uninterrupted decline at every intervening election. Turnout recovered during parts of the period after 2001. Nor does lower turnout reveal a single motive. Disillusion is loss of confidence that politics can deliver; apathy is insufficient interest or motivation. Barriers and the perceived competitiveness of a contest also matter. If you sit in 2027: Issue 3's glossary mistakenly prints “no confident”; Issue 4 corrects it to “no confidence”. Use the accurate meaning for either series.
Class and party attachment change differently
Class-based voting is an association between a person's social class and party choice. Occupational social grade is one measurable proxy, but it does not capture every voter's wealth or subjective identity. ABC1 groups non-manual occupations; C2DE groups manual and other lower-grade categories. A changing occupational association does not alone prove a change in how people identify themselves.
MORI's historical aggregates estimate that in 1979 the Conservatives won 59% of ABC1 votes and Labour 24%; C2 divided 41% to each party, while DE favoured Labour 49% to 34%. In 1997, the aggregate's ABC1 estimate was Conservative 39% and Labour 34%, while Labour led strongly in C2 and DE. The 1997 Labour advance therefore crossed class boundaries without abolishing class differences. MORI/Ipsos overview.
YouGov's 2024 post-election study estimated Labour 36% versus Conservative 25% among ABC1 voters, and 33% versus 23% among C2DE. Those similar Labour–Conservative patterns across the two broad grades differ sharply from the traditional expectation of middle-class Conservative and working-class Labour voting. Reform's stronger C2DE support adds another dimension. This comparison uses broad grades and different survey methods, so it demonstrates a substantial change of pattern rather than a precisely measured continuous causal effect. YouGov national study, 8 July 2024.
Class dealignment and partisan dealignment
Class dealignment weakens the connection between class identity and voting. Partisan dealignment weakens enduring identification with a party. They can occur together, but one does not automatically establish the other.
A person might retain a strong Labour identity while changing occupation, or temporarily vote against the party without losing that identity. The BES long-term national series shows declining strong party identification between 1979 and the 1990s. Its published graph supports direction and context, not precise percentages extracted by eye. In 2024, Ipsos's reported vote flows showed substantial movement away from 2019 Conservative votes, especially towards Reform. That measures switching rather than identification. BES, slide 33; Ipsos 2024.
Weakening attachments can increase the scope for performance, issues and tactical considerations to influence choices. Remaining attachments can still filter information and help explain why a government's poor record does not make all of its supporters desert it. Declining attachment and surviving loyalty are compatible findings.
Gender gaps and age differences
Gender patterns vary by election and party. MORI estimated Conservative support in 1979 at 47% among women and 43% among men, with Labour at 35% and 40%. In 1997 Labour's estimates were 44% among women and 45% among men. The first comparison shows a larger traditional gender difference; the second shows a broad Labour coalition among both groups. It does not follow that every woman changed her preference, because these are separate cross-sectional samples. Historical overview.
The 2024 main-party gender difference was modest, while Ipsos estimated Reform at 17% among men and 13% among women. The relevant question is therefore which party, age group and election are being compared. An aggregate can hide differences within younger or older groups. Interests associated with paid employment, care, housing or public services can be relevant mechanisms, but broad sex categories are not fixed sets of political opinions.
Age also changed in its relationship with vote. In 1979 the Conservative–Labour estimates were 42%–41% among 18–24s and 47%–38% among those aged 55+. In 1997 Labour led in every reported age band, including 49%–27% among 18–24s and 41%–36% among those aged 65+. By 2024, Ipsos estimated Labour 41% and Conservative 5% among 18–24s, while over-65s favoured the Conservatives 43%–23%. 1997 detail; 2024 detail.
These are changes in association, not proof that age alone explains the outcome. Life-stage interests, generations' formative experiences and circumstances specific to an election can all contribute. The older category also changes from 55+ in the selected 1979 table to 65+ later, so its percentages are not a perfectly matched series. Younger groups tend to participate less in the later surveys; a party's strength among young adults therefore does not translate automatically into an equally large share of ballots.
Ethnicity and territory without stereotyping
National ethnicity evidence is uneven. Our verified 1979 overview contains no ethnic breakdown, so it cannot provide a numerical starting point. In 1997 MORI estimated Labour at 70% in its combined non-white category and 43% among white voters. Ipsos's 2024 estimates were 46% among ethnic minority voters and 33% among white voters, including white minorities. These differently defined categories, sampling methods and population compositions prevent an exact like-for-like claim about the size of a long-term change. They support a more limited conclusion: Labour had a substantial minority-group advantage in both measured elections, while the 2024 aggregate was lower. 1997 source; 2024 source and subgroup cautions.
Ethnicity can relate to experiences of discrimination, party ties and policy concerns, but broad categories conceal differences in religion, income, age and geography. Labour support differed between Black and Asian groups in both reports. Smaller subgroup bases make their precise estimates less secure. Do not assign the group average to every member or confuse constituency demographic composition with individual votes: that would be an ecological inference error.
Territorial patterns also persist and change. Labour led the Conservatives in Scottish votes in 1979 despite losing nationally. In 1997 the Conservatives won no Scottish or Welsh seats. In 2024 Labour recovered Scottish representation as the SNP fell to nine seats. Different local party systems, industrial histories and views of national identity help explain why one UK trend has different regional expressions. Historical country tables; 2024 results.
An actual regional vote total is strong evidence about that region's ballots, but weak evidence about an individual's motive. GB surveys do not cover Northern Ireland, where unionist, nationalist and other parties create different choices. A UK result and a GB demographic estimate must be labelled accordingly.
Linking social patterns to political choices
Social position and short-term politics interact. Governing competency is the perceived ability of a governing or opposition party to manage public affairs effectively. In 1979, industrial conflict made competence and union reform salient while class differences remained strong. In 1997, New Labour's economic reassurance and social promises sought to expand a coalition in the context of Conservative fatigue and damaged trust. In 2024, Labour again offered credible change, but several alternative parties gained from Conservative losses and participation was lower. Manifestos, campaign organisation and leadership presentation help explain why the same broad group need not choose the same party at every election.
Consider the argument that class became less useful for predicting a Labour–Conservative vote. Its evidence is the pronounced ABC1 contrast in 1979 and the much smaller difference between broad grades in 2024. The reasoning is that party offers and political identities can cross occupational boundaries, leaving other dimensions more influential. A qualification is that class still differentiated Reform support and overlaps with education and housing. The justified conclusion is a weakening of a particular traditional alignment, not the disappearance of material interests from politics.
Now consider turnout. Compare official valid-vote percentages across the three cases, but do not join them to Ipsos's 2024 demographic turnout estimates without a warning. The latter use all resident adults, whereas the former use registered electors. Even Ipsos says its post-2015 demographic turnout series cannot be directly matched to earlier estimates. A group may favour a party among those voting while many of its members abstain.
The best national-data explanation states the observed association, proposes a taught mechanism, and identifies what further evidence would discriminate between alternatives. Surveys of reasons and repeated panels can help; even these face recall, sampling and confounding problems. A difference between groups is not a controlled experiment in class, age or media exposure.
If you sit in 2027: leadership is implicit in the earlier case-study discussion rather than explicitly listed as it is in Issue 4 from June 2028. This comparison links it to the common policies, campaigning and context requirements; any specifically Issue 4-only assessment demand must be series-labelled.