1.4-1.7C - Solutions, solubility curves and solubility practical
A solution forms when one substance dissolves in another. In this lesson, you will learn the exact language for solutions, how solubility is measured in g per 100 g of solvent, how to read and draw solubility curves, and how the Edexcel solubility practical turns mass readings into a solubility value.
Solution language
In Chemistry, everyday words like "dissolve" and "solution" need precise meanings. A solution is not just any liquid mixture: it is formed when a solute dissolves in a solvent.
The solvent is the liquid that dissolves another substance. The solute is the substance that dissolves in the solvent. The solution is the mixture formed when the solute dissolves.
For example, if sodium chloride dissolves in water, sodium chloride is the solute, water is the solvent, and the salt water formed is the solution.
A solution becomes saturated when no more of that solute can dissolve at that temperature. If extra solid is added to a saturated solution, it stays undissolved at the bottom.
Saturated solution
A saturated solution contains as much dissolved solute as possible at a particular temperature.
Temperature matters. A solution saturated at one temperature may not be saturated at another temperature, because the amount of solid that can dissolve can change as temperature changes.
Measuring solubility
Solubility tells you the maximum mass of solute that dissolves in a fixed mass of solvent at a stated temperature. For this specification, the unit is:
That means the solvent mass is always scaled to 100 g. A solubility of 35 g per 100 g of water means that, at that temperature, 35 g of the solid dissolves in 100 g of water to make a saturated solution.
Solubility
Solubility is the mass of solute that dissolves in 100 g of solvent to form a saturated solution at a particular temperature.
This definition turns into a ratio calculation when the solvent mass is not exactly 100 g.
Solubility from masses
Worked example: a saturated solution contains 10.5 g of dissolved solid in 16.8 g of water.
The answer is not just 62.5 g. The full unit matters because it tells you the result has been scaled to 100 g of solvent.
Solubility curves
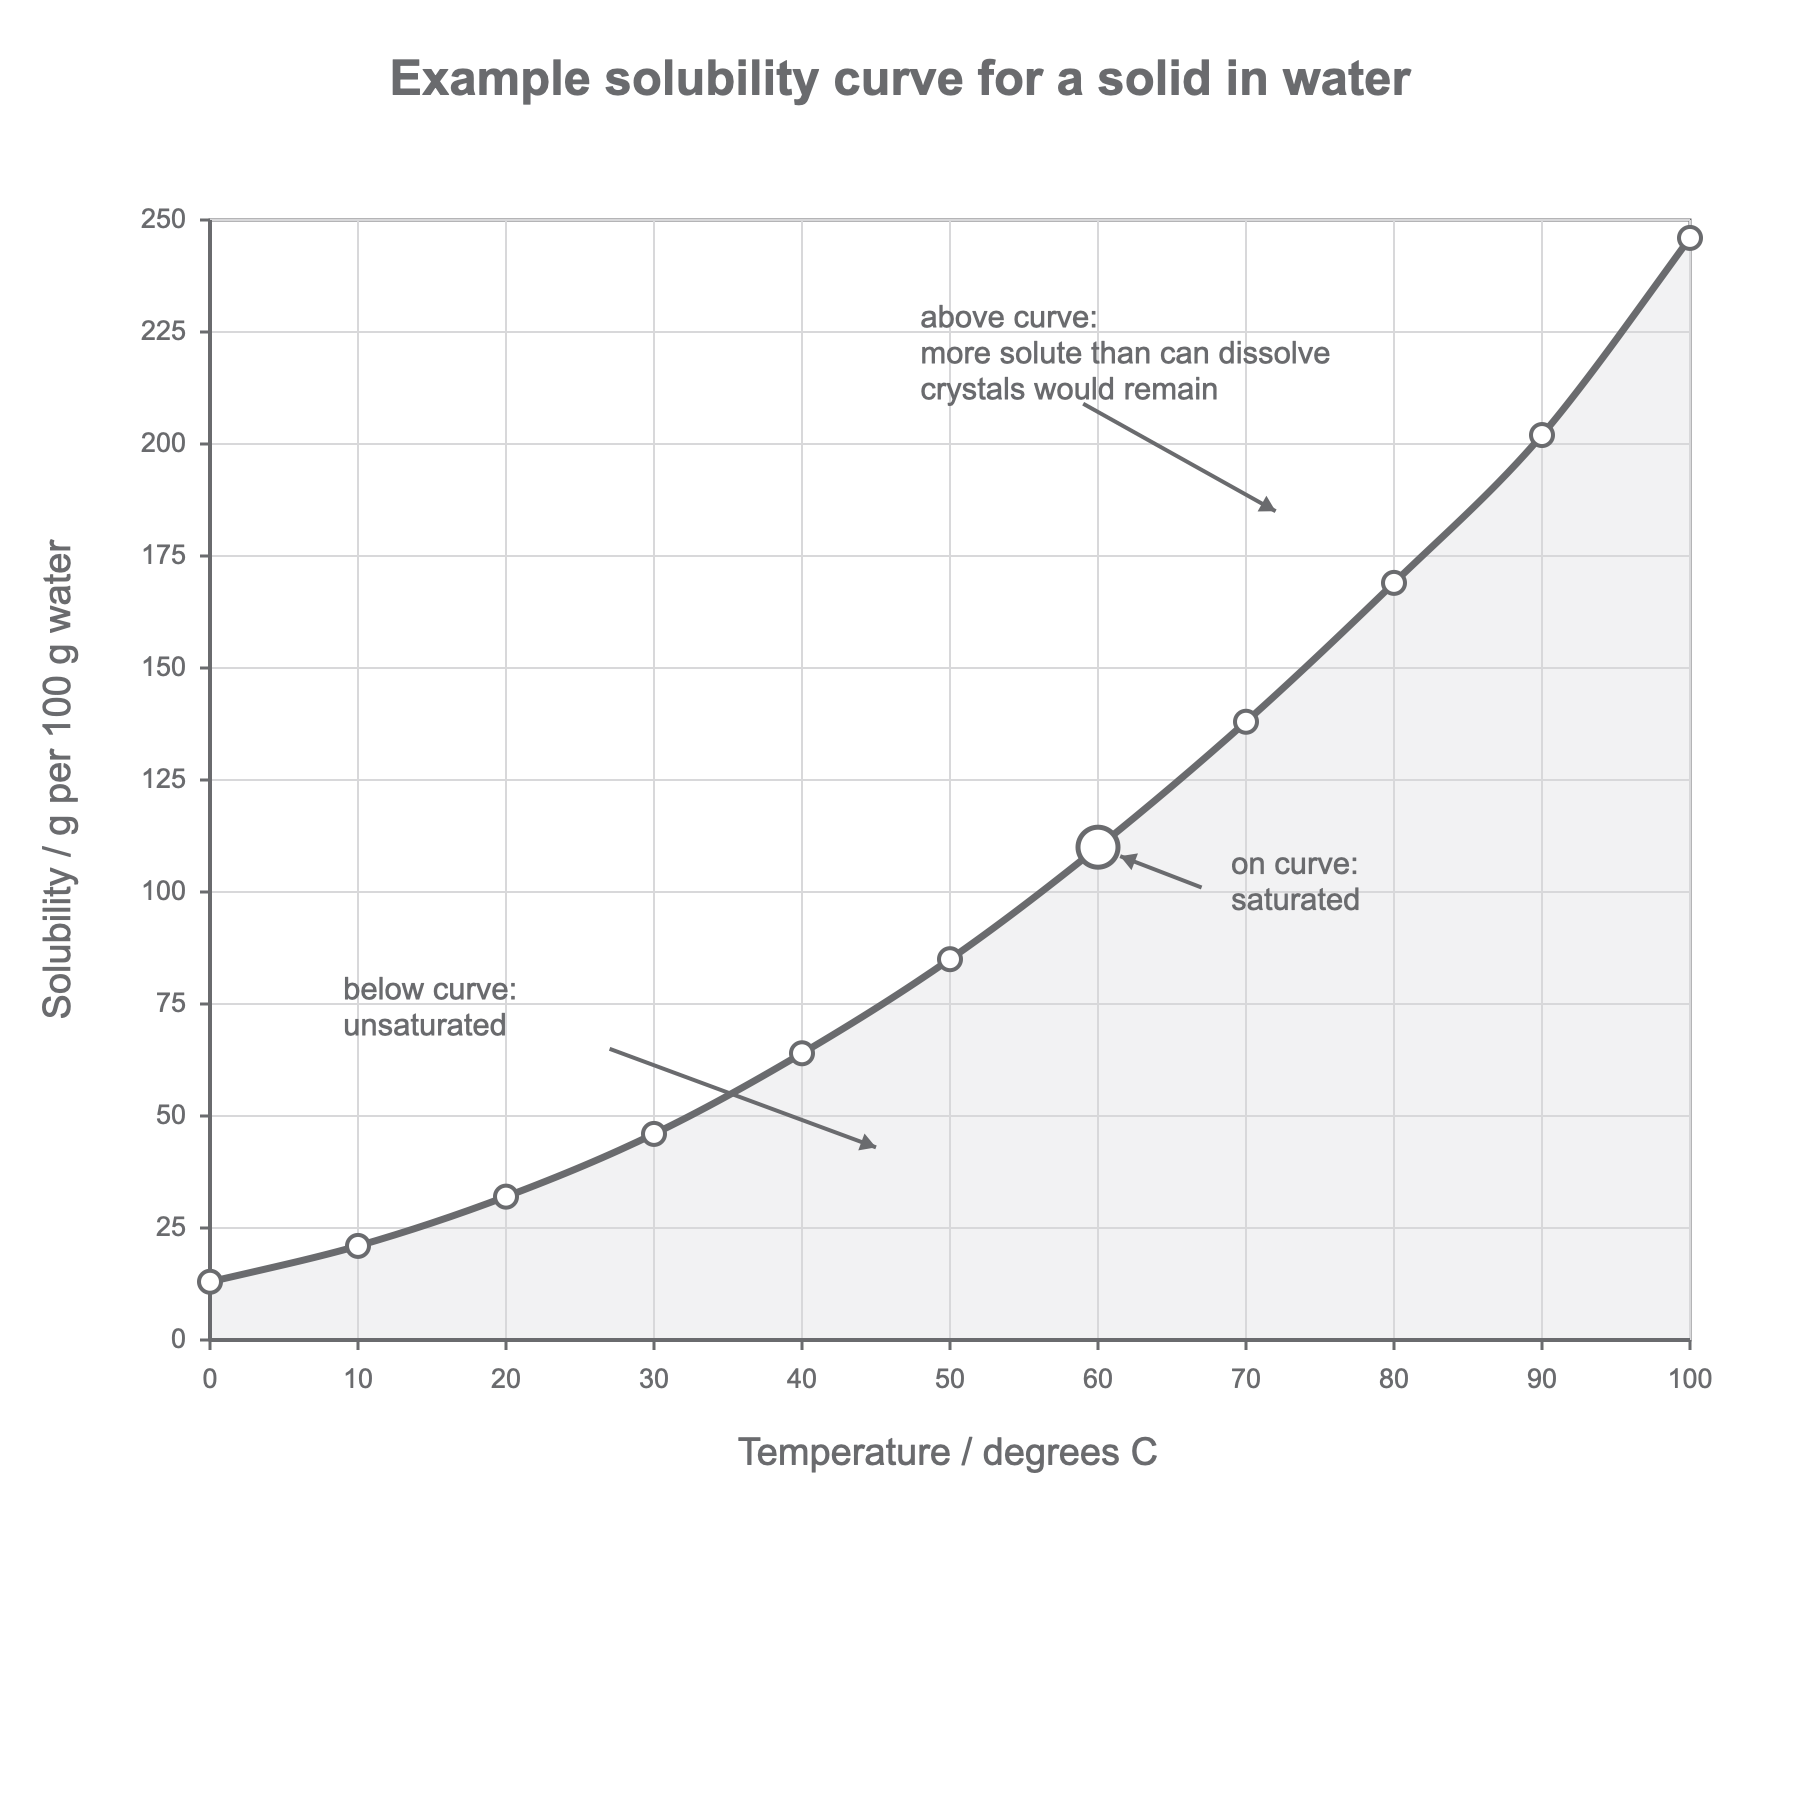
A solubility curve is a graph showing how solubility changes with temperature. Temperature goes on the x-axis. Solubility, in g per 100 g of solvent, goes on the y-axis.
[DIAGRAM: asset_name: Solutions, solubility curves and solubility practical - diagram 01; asset_slug: c02_solutions_solubility_curves_and_solubility_practical__diagram_01; recommended_method: deterministic_drawing; description: Monochrome graph of an example solubility curve for a solid in water, with temperature on the x-axis, solubility in g per 100 g water on the y-axis, plotted points, a smooth increasing curve, and labelled regions showing unsaturated below the curve, saturated on the curve, and crystals remaining above the curve.]
To plot a solubility curve:
- Put temperature on the x-axis and choose an even scale.
- Put solubility on the y-axis and include the unit
g per 100 g of solvent. - Plot each pair of values from the results table carefully.
- Draw a smooth curve through the pattern of points.
- Do not force the curve through an anomalous point if the rest of the data show a clear pattern.
To read a curve, draw across from the temperature to the curve, then across to the solubility axis. If the temperature is between two plotted points, use the curve to estimate the value.
The position of a point compared with the curve tells you what sort of solution you have:
- on the curve: saturated
- below the curve: unsaturated, so more solute could dissolve
- above the curve: more solute is present than can dissolve, so undissolved solid or crystals would remain
Many solids become more soluble as temperature increases, so their curves rise. Do not assume every solid has the same curve or the same steepness: the graph data decide the answer.
Practical method
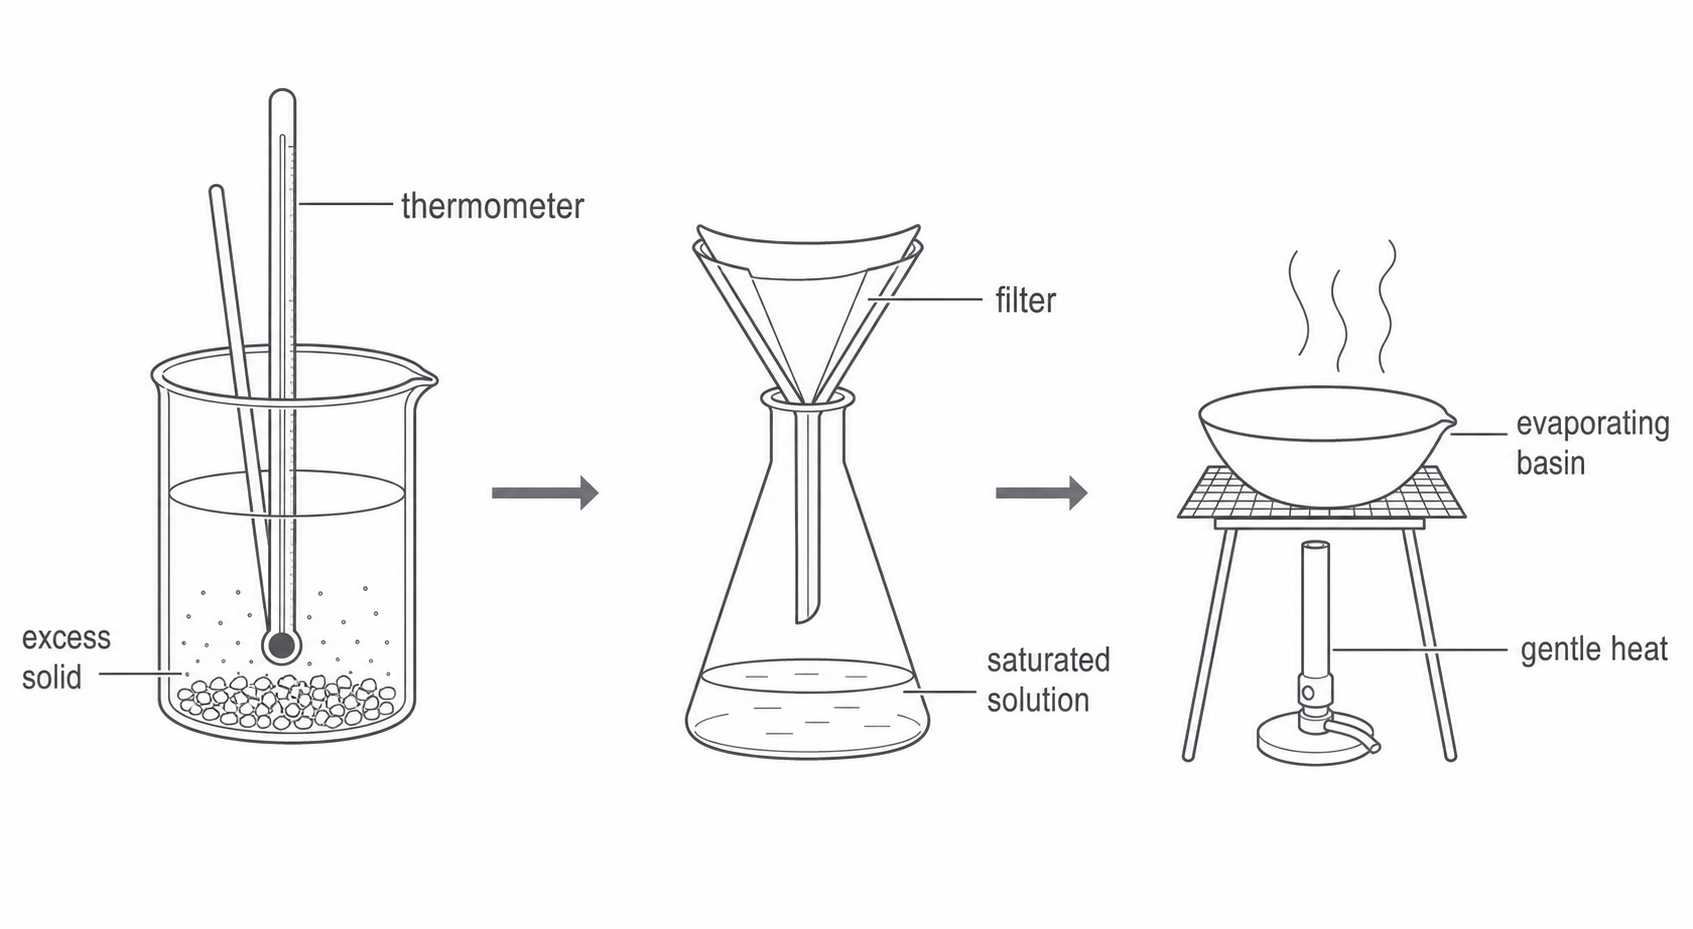
The practical finds the solubility of a solid in water at a specific temperature. The key idea is simple: make a saturated solution at a measured temperature, remove any undissolved solid, then find the mass of dissolved solid and the mass of water in a sample of the saturated solution.
[DIAGRAM: asset_name: Solutions, solubility curves and solubility practical - diagram 02; asset_slug: c02_solutions_solubility_curves_and_solubility_practical__diagram_02; recommended_method: image_gen; description: Monochrome apparatus flow diagram for the solubility practical showing excess solid stirred with water and a thermometer, filtration to collect saturated solution, then gentle heating of an evaporating basin to remove water.]
One suitable method is:
- Add water to a beaker or boiling tube and bring it to the chosen temperature using a water bath.
- Add the solid a little at a time, stirring, until no more dissolves and some excess solid remains.
- Measure the temperature of the saturated solution.
- Filter the mixture to remove the undissolved solid.
- Weigh an empty evaporating basin.
- Add some of the saturated filtrate to the basin and weigh the basin and filtrate.
- Gently heat the basin to evaporate the water.
- Cool the basin and weigh the basin and dry solid. Reheat, cool and reweigh if needed until the mass is constant.
The excess solid is important because it shows the solution has become saturated. Filtering is important because undissolved solid must not be counted as dissolved solute.
If the investigation is repeated at different temperatures, the independent variable is temperature and the dependent variable is solubility. Control variables include the identity of the solid, the solvent, the method used to reach saturation, and the way the filtrate is evaporated and weighed.
Use eye protection, take care with hot apparatus and the Bunsen burner or water bath, and handle the solid according to the teacher's safety instructions.
Processing and evaluating results
The practical uses three mass readings:
| Measurement | Example mass / g |
|---|---|
| empty evaporating basin | 89.6 |
| evaporating basin + saturated solution | 115.8 |
| evaporating basin + dry solid | 94.9 |
First find the mass of solid left after evaporation:
Then find the mass of saturated solution used:
The saturated solution was made from water and dissolved solid, so:
Finally calculate the solubility:
You can also find the mass of water directly:
In this example:
Good evaluation answers explain the direction of the error, not just that the result is "inaccurate".
If undissolved solid is accidentally transferred into the evaporating basin, the final mass of solid is too high, so the calculated solubility is too high. If the solution is not actually saturated, the mass of dissolved solid is too low, so the calculated solubility is too low. If the basin is heated too strongly and the solid decomposes to form a gas, some product escapes, the final solid mass is too low, and the calculated solubility is too low.
Useful improvements include keeping the temperature constant during saturation, filtering carefully, heating gently, heating to constant mass, cooling before weighing, and repeating results at the same temperature to check reliability.
Solubility is found by making a saturated solution at a known temperature, measuring the mass of dissolved solid and water in a sample, then scaling the result to g per 100 g of solvent.
The final check below uses the same cause-and-effect wording that earns marks in this practical.