P1.4.6 - Sequences and series in modelling
Sequences and series become useful when a repeated real-world change has a clear pattern. In this lesson you will learn how to translate a context into an arithmetic model, a geometric model, or a relation-defined model, then use the model to calculate and interpret terms or totals. The main skill is choosing the right structure before reaching for a formula.
Choose the model from the wording
A model is a deliberately simplified mathematical description of a situation. In this topic, the model is usually a sequence of individual terms or a series formed by adding those terms.
Sequence and series in a model
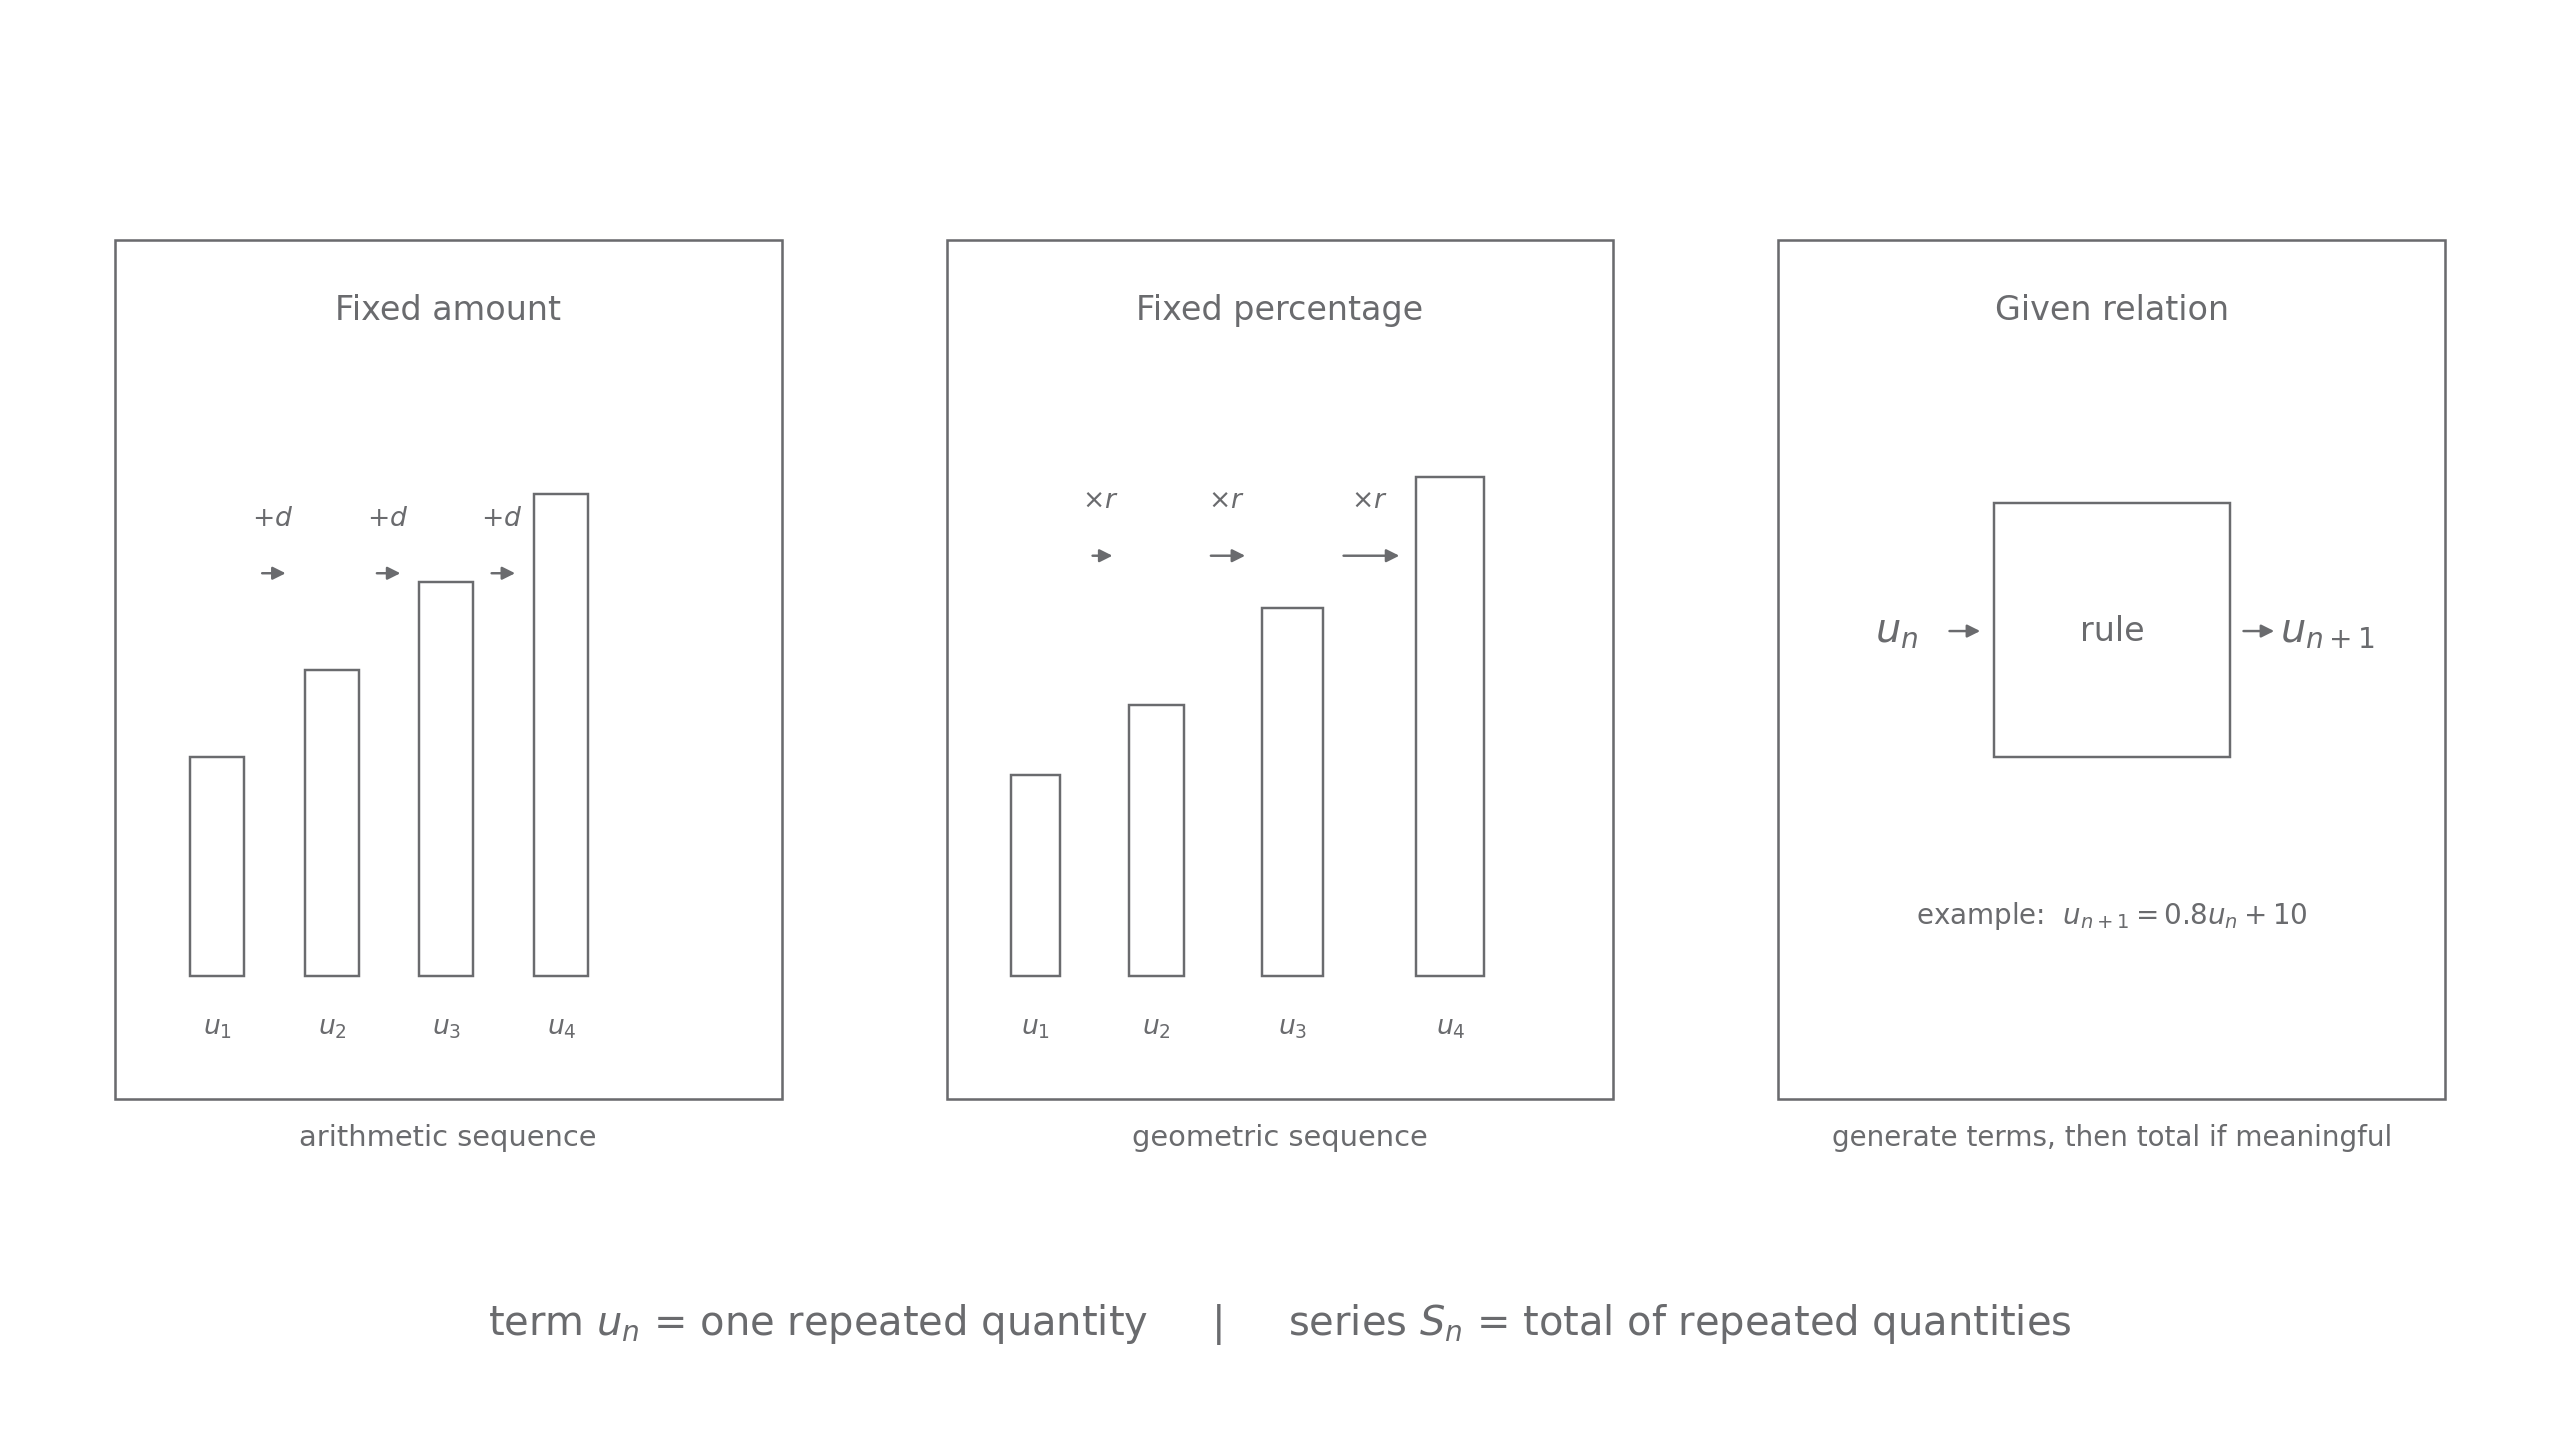
A sequence lists repeated quantities such as monthly payments, yearly populations, or successive distances. A series is the total formed by adding terms of a sequence.
The first decision is not "which formula do I remember?" It is "what does one term represent?" If u_n is the nth monthly payment, then S_n is the total of the first n monthly payments. If u_n is the amount remaining after the nth cycle, then adding the terms may or may not have a sensible meaning.
[DIAGRAM: asset_name: Lesson p1.4.6: Use sequences and series in modelling - diagram 01; asset_slug: p1_4_6_use_sequences_and_series_in_modelling__diagram_01; recommended_method: drawn_math; description: Draw a clean three-panel 16:9 model-choice diagram. Panel 1 shows payments increasing by a fixed amount with equally stepped bars and label "fixed amount -> arithmetic". Panel 2 shows payments increasing by a fixed percentage with multiplicative arrows labelled "x r" and label "fixed percentage -> geometric". Panel 3 shows a recurrence flow u_n -> rule -> u_{n+1} with label "given rule or relation -> generate terms". Include a small note below all panels: "term = one repeated quantity; series = total of repeated quantities". Use direct labels, spacious margins, and NovaLearn style.]
Use this translation habit:
| Context wording | Model type | Usual calculation |
|---|---|---|
| "Increases by the same amount each time" | arithmetic sequence | find u_n or S_n |
| "Decreases by the same amount each time" | arithmetic sequence | find u_n or S_n, then check reasonableness |
| "Increases by the same percentage each time" | geometric sequence | multiply by r = 1 + p/100 |
| "Decreases by the same percentage each time" | geometric sequence | multiply by r = 1 - p/100 |
| "The next term is found from..." | relation-defined sequence | generate terms using the rule |
Worked example: choose the model.
A student saves 30 pounds in week 1 and saves 4 pounds more each week than in the previous week.
The repeated quantity is the amount saved in each week, so let u_n be the amount saved in week n. The phrase "4 pounds more each week" means a fixed amount is added each time. So the weekly savings form an arithmetic sequence with
The amount saved in week n is a term, u_n. The total saved over several weeks is a series, S_n.
Arithmetic models for fixed changes
Use an arithmetic model when consecutive terms differ by a constant amount. If the first term is a and the common difference is d, then
and
In a modelling question, d can be negative. A decreasing arithmetic model is still arithmetic, but it may become unrealistic once terms become negative.
Worked example: model a saving scheme with fixed increases.
Nadia pays 40 pounds into a savings account in month 1. Each month after that, she pays 5 pounds more than in the previous month.
Find:
- the payment in month 12
- the total paid in during the first 12 months
Let u_n be the payment in month n. The payments increase by a fixed amount, so
The month 12 payment is
So Nadia pays 95 pounds in month 12.
For the total paid in during the first 12 months, use the series:
Therefore
So Nadia pays in a total of 810 pounds over the first 12 months.
Notice the distinction: u_12 is one payment, but S_12 is the accumulated total.
Arithmetic models for fixed changes Continued
A common modelling error is to use n instead of n-1. The 15th row is reached after 14 increases from the first row, not 15 increases.
Geometric models for fixed percentages
Use a geometric model when each term is multiplied by the same factor. If the first term is a and the common ratio is r, then
and, for r \ne 1,
You may also use the equivalent form
when r>1, since it keeps the numerator and denominator positive.
Worked example: model payments increasing by a fixed percentage.
A charity pledge is 1200 pounds in year 1. The pledge increases by 6% each year. Find:
- the pledge in year 8
- the total pledged over the first 8 years
A 6% increase means multiply by
The year 8 pledge is the 8th term:
So the year 8 pledge is approximately 1804 pounds to the nearest pound.
The total over the first 8 years is a series:
This gives
So the total pledged over the first 8 years is approximately 11877 pounds to the nearest pound.
The modelling assumption is that the 6% increase applies at the same interval each year and that the pledge can be treated as a continuous amount of money before rounding.
Geometric models for fixed percentages Continued
Be careful with percentage language. An increase of 5% means r=1.05, not r=5. A decrease of 5% means r=0.95, not r=0.05.
Infinite and limiting models
Some modelling questions describe repeated changes that continue for a long time. If the terms form a geometric sequence with |r|<1, then the infinite series has a finite sum:
The condition |r|<1 matters. It means the terms get smaller in size, so the accumulated total approaches a limit.
Worked example: use a limiting series.
A dripping tap releases 36 ml in the first minute. The amount released in each following minute is 80% of the amount released in the previous minute. According to the model, find the total amount of water released if the pattern continues indefinitely.
Let u_n be the amount released in minute n. The terms form a geometric sequence with
Since |0.80|<1, the infinite series formula is valid:
According to the model, the total amount released is 180 ml.
This does not mean the tap literally releases water forever in perfect geometric amounts. It means the model predicts a limiting total of 180 ml if the same percentage pattern is continued.
The main misconception is to check only that r<1. The full condition is |r|<1. For most percentage-decrease contexts r is positive, but exam questions about geometric series may include negative ratios.
Models defined by a relation
The specification also allows models where the sequence is defined by a formula or a relation. In these cases, the model may not be arithmetic or geometric. If a recurrence relation is given, use it carefully to generate the required terms.
Worked example: use a recurrence model.
In a simple model, the amount of a chemical used on day n is u_n grams. The first day uses 120 g, and after each day the next amount is modelled by
Find the total amount used over the first 4 days.
Start from u_1=120:
So the total over the first 4 days is
The first 4 days use 406.64 g in total.
This is not an arithmetic sequence, because the differences are not constant. It is not a geometric sequence, because the ratios are not constant. The relation itself is the model.
Models defined by a relation Continued
When a relation is used in a context, state what the term means. If u_n is a daily amount, summing terms gives a total amount. If u_n is the amount remaining at the end of day n, summing the amounts remaining usually has no direct physical meaning.
Interpret and check the model
A complete modelling answer does more than calculate. It defines the term, chooses the structure, carries units through the calculation, and checks whether the conclusion makes sense.
Use this four-step routine:
- Define one term, such as "let
u_nbe the payment in monthn". - Decide whether the pattern is arithmetic, geometric, or relation-defined.
- Decide whether the question asks for one term
u_nor a totalS_n. - Interpret the result with units and mention a limitation if the context asks for one.
Worked example: choose the method and interpret.
A theatre expects to sell 240 season tickets in week 1. In each following week, the number of tickets sold is expected to be 12% lower than in the previous week. The model is used for 8 weeks.
Let u_n be the number of tickets sold in week n. A 12% decrease means
The total number sold over 8 weeks is
The model predicts about 1281 tickets sold over the first 8 weeks. A sensible limitation is that ticket sales are whole numbers and may not keep decreasing by exactly 12% every week.
Explain It Back
Use this as a self-explanation check after the section above. It is for diagnosing what you can already explain, not for learning new material from scratch.
That final check is the whole modelling cycle in miniature: define the term, choose the structure, calculate the requested total, and judge the assumption behind the answer.