P1.2.5 - Linear and quadratic inequalities
An inequality asks for all values that make a statement true, not just a single value that balances two sides. In this lesson you will solve linear and quadratic inequalities in one variable, express answers with correct and, or, or set notation, and interpret inequalities using graphs. The central idea is that critical values split the number line into regions where an expression is positive, negative, above another graph, or below another graph.
Inequalities describe solution sets
Solving an equation usually finds particular values. Solving an inequality finds a set of values. For example, the solution of
is not one number. It is every value of x for which the left side is greater than the right side.
The safest way to solve a linear inequality is to use equation-style steps, but remember the sign rule.
Adding or subtracting the same expression keeps the inequality direction. Multiplying or dividing by a negative number reverses it.
Worked example: solve
Subtract 7 from both sides:
Now divide by -3. Since this is a negative number, reverse the inequality:
So the solution set is all real x such that x >= -4. In set notation:
Do not rush the final line. The answer x <= -4 would solve a different problem.
Inequalities describe solution sets Continued
An interval such as
means x > -1 and x <= 5. Both conditions must be true at the same time. A disjoint answer such as
means either interval works. In set notation this is
The word and matches an overlap or bounded interval. The word or matches separate intervals.
Use roots to split a quadratic inequality
A quadratic inequality is easiest to understand from the graph of the corresponding quadratic function. The roots are the boundary values where the expression is exactly zero. Between and outside those roots, the expression has a constant sign.
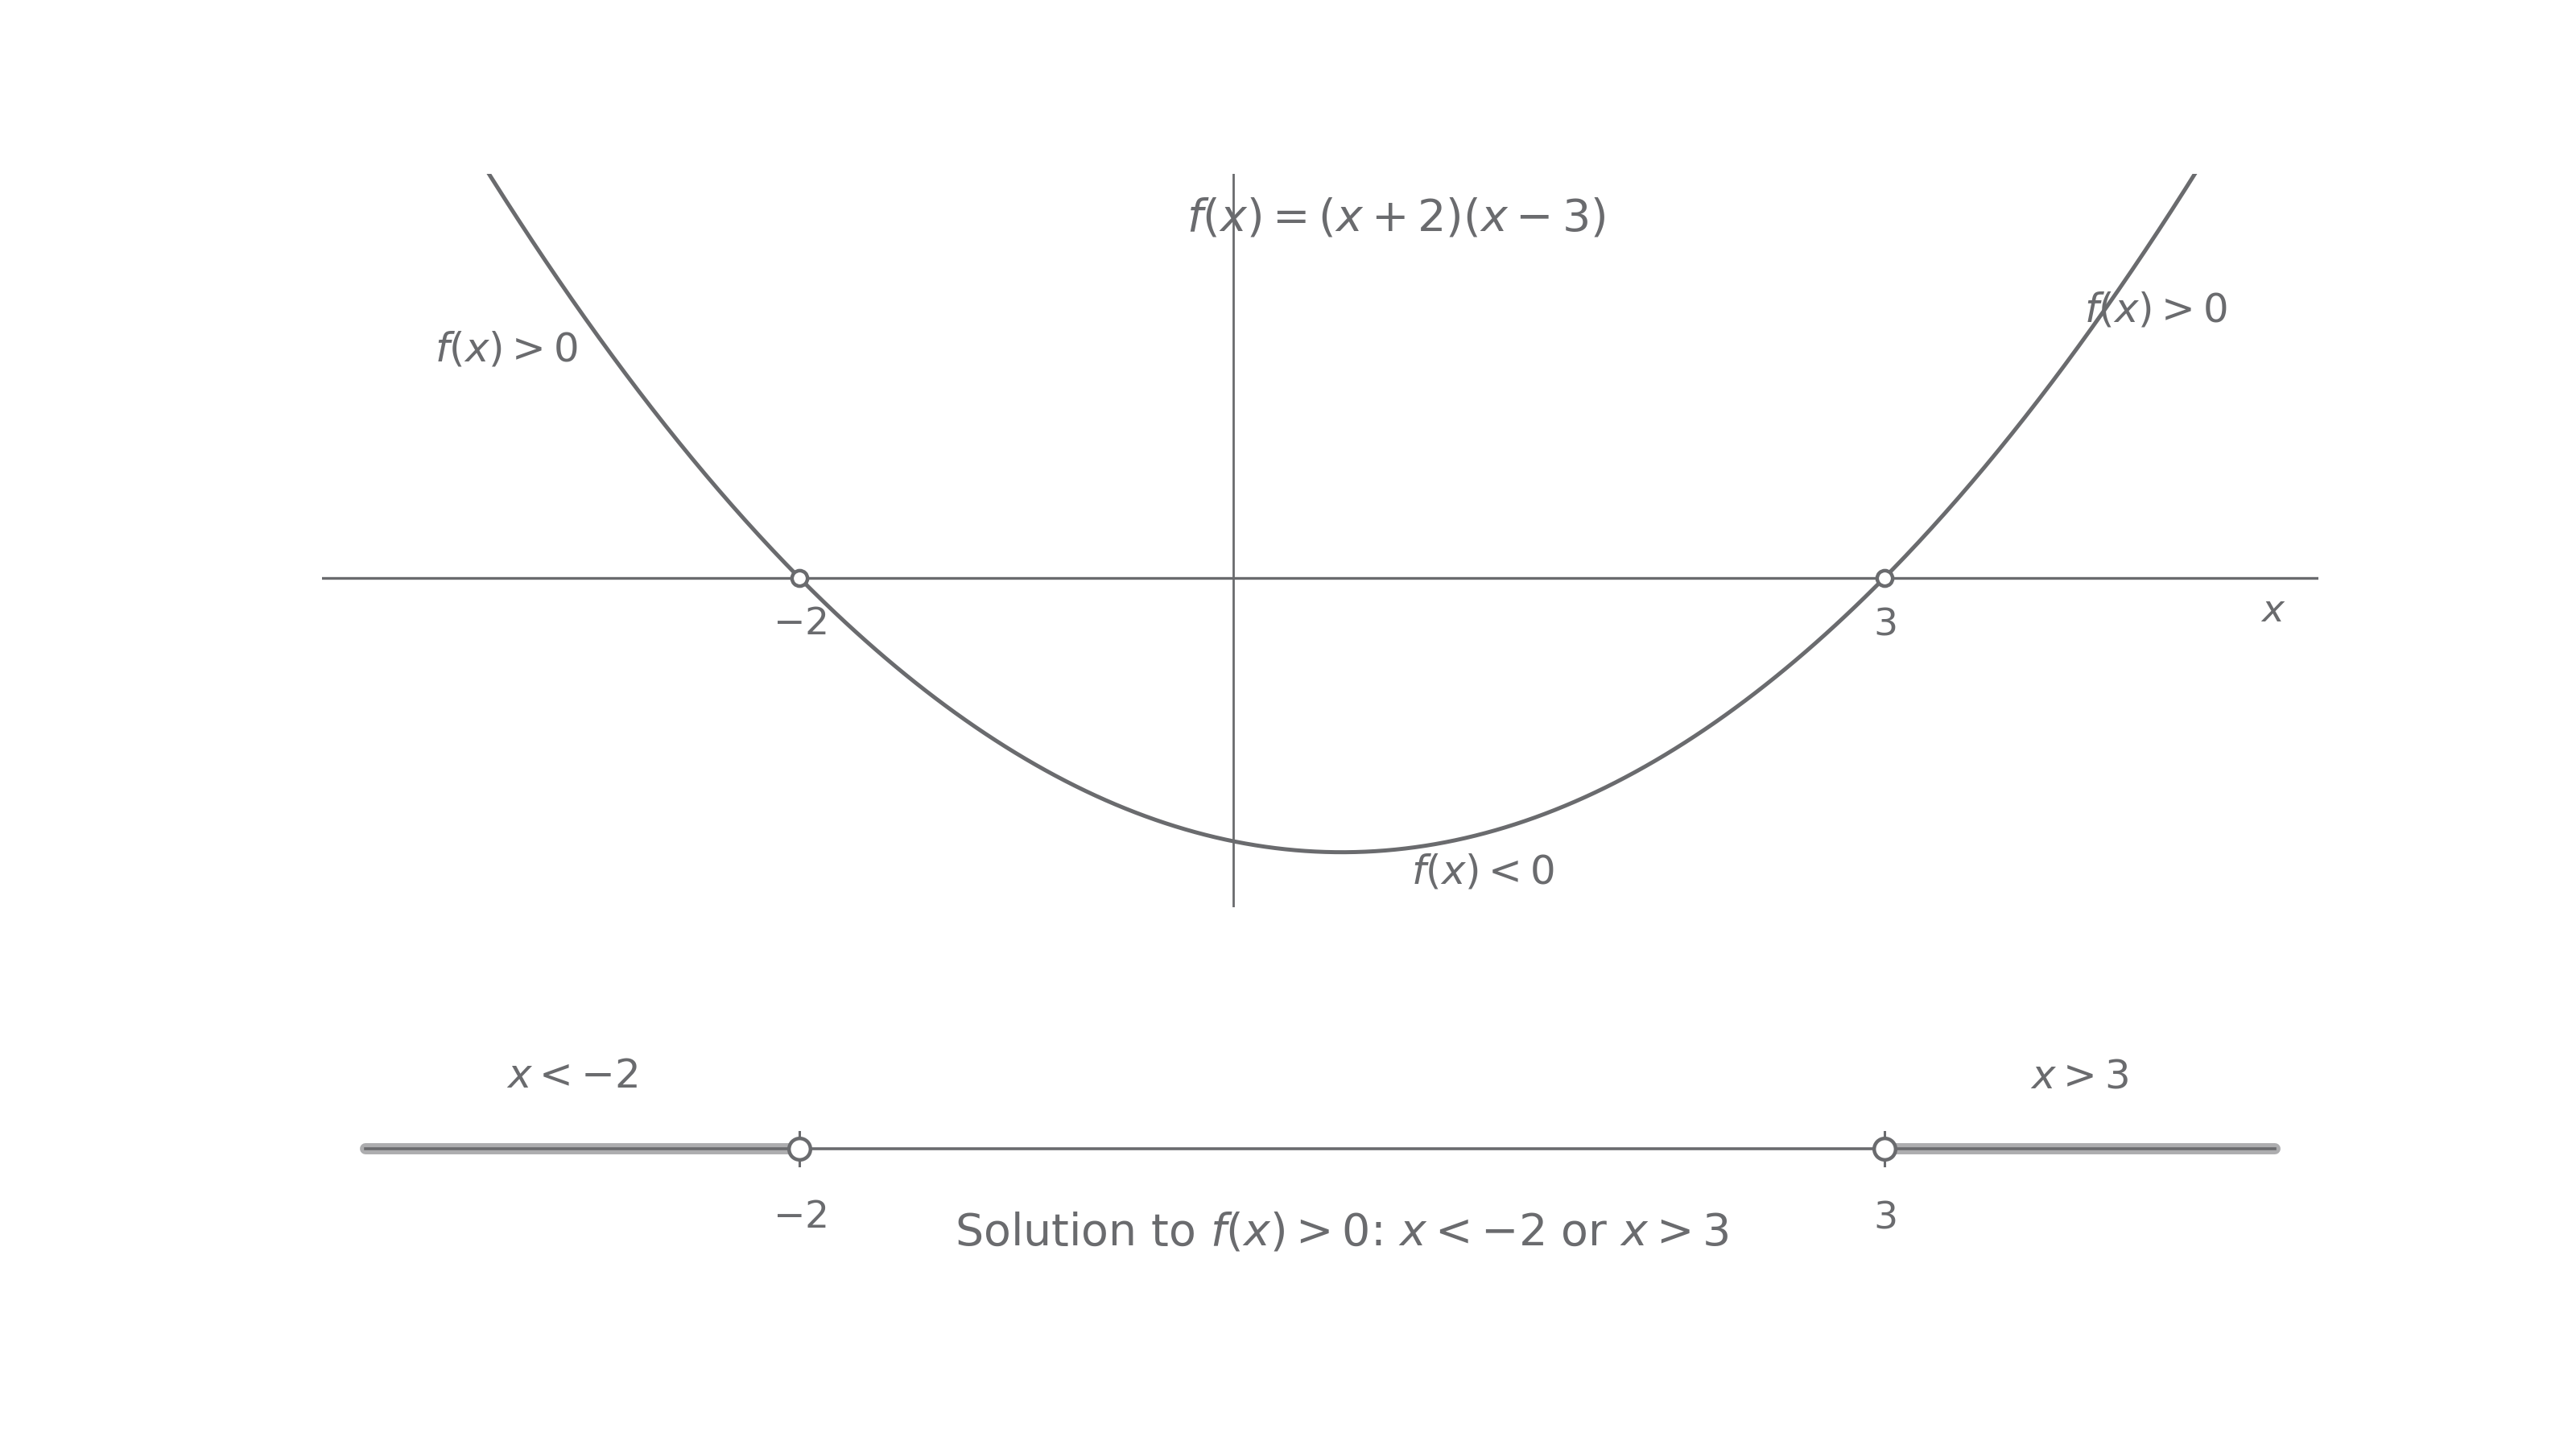
[DIAGRAM: asset_name: Lesson p1.2.5: Solve and interpret linear and quadratic inequalities - diagram 01; asset_slug: p1_2_5_solve_linear_and_quadratic_inequalities_in_a_single_variable_and_interpret_such_inequalities_graphically__diagram_01; recommended_method: drawn_math; description: Draw the graph of f(x)=(x+2)(x-3) with x-intercepts -2 and 3, plus a number line underneath showing the strict solution to f(x)>0 as x<-2 or x>3. Use open endpoint circles at -2 and 3 and label the positive and negative regions directly.]
Worked example: solve
First factorise:
Find the boundary values by solving the equation:
so
The quadratic opens upwards, so it is above the x-axis outside its two roots and below the x-axis between them. The inequality asks for > 0, so we choose the outside intervals.
Therefore
In set notation:
Notice that the roots are not included because the inequality is strict. If the question had used >= 0, the answer would have included x = -2 and x = 3.
Use roots to split a quadratic inequality Continued
If the coefficient of is negative, the graph opens downwards. You can still use exactly the same method: find the boundary values, sketch the shape, and choose where the graph is above or below the axis. A quick sketch is more reliable than trying to memorise a rule.
Reduce brackets and fractions safely
Edexcel includes inequalities with brackets and fractions when they reduce to linear or quadratic inequalities. Brackets usually just need expansion. Fractions need more care because multiplying or dividing by an expression containing x may change the sign depending on the value of x.
Worked example with brackets: solve
Expand and collect all terms on one side:
so
Factorise:
The roots are -5 and 2. The quadratic opens upwards, so it is non-negative outside the roots:
Now consider a fraction. For
you must not multiply by x, because x might be positive or negative. Instead multiply by , which is positive for every allowed value :
becomes
Now rearrange:
so
The critical values are and . The product is positive outside these values, giving
The condition is already respected because the inequality is strict and the interval does not include 0.
Reduce brackets and fractions safely Continued
The important habit is this: if the sign of the multiplier is not known, do not divide or multiply by it directly. Rearrange to a standard inequality or multiply by a quantity whose sign is guaranteed.
Interpret curve below line inequalities
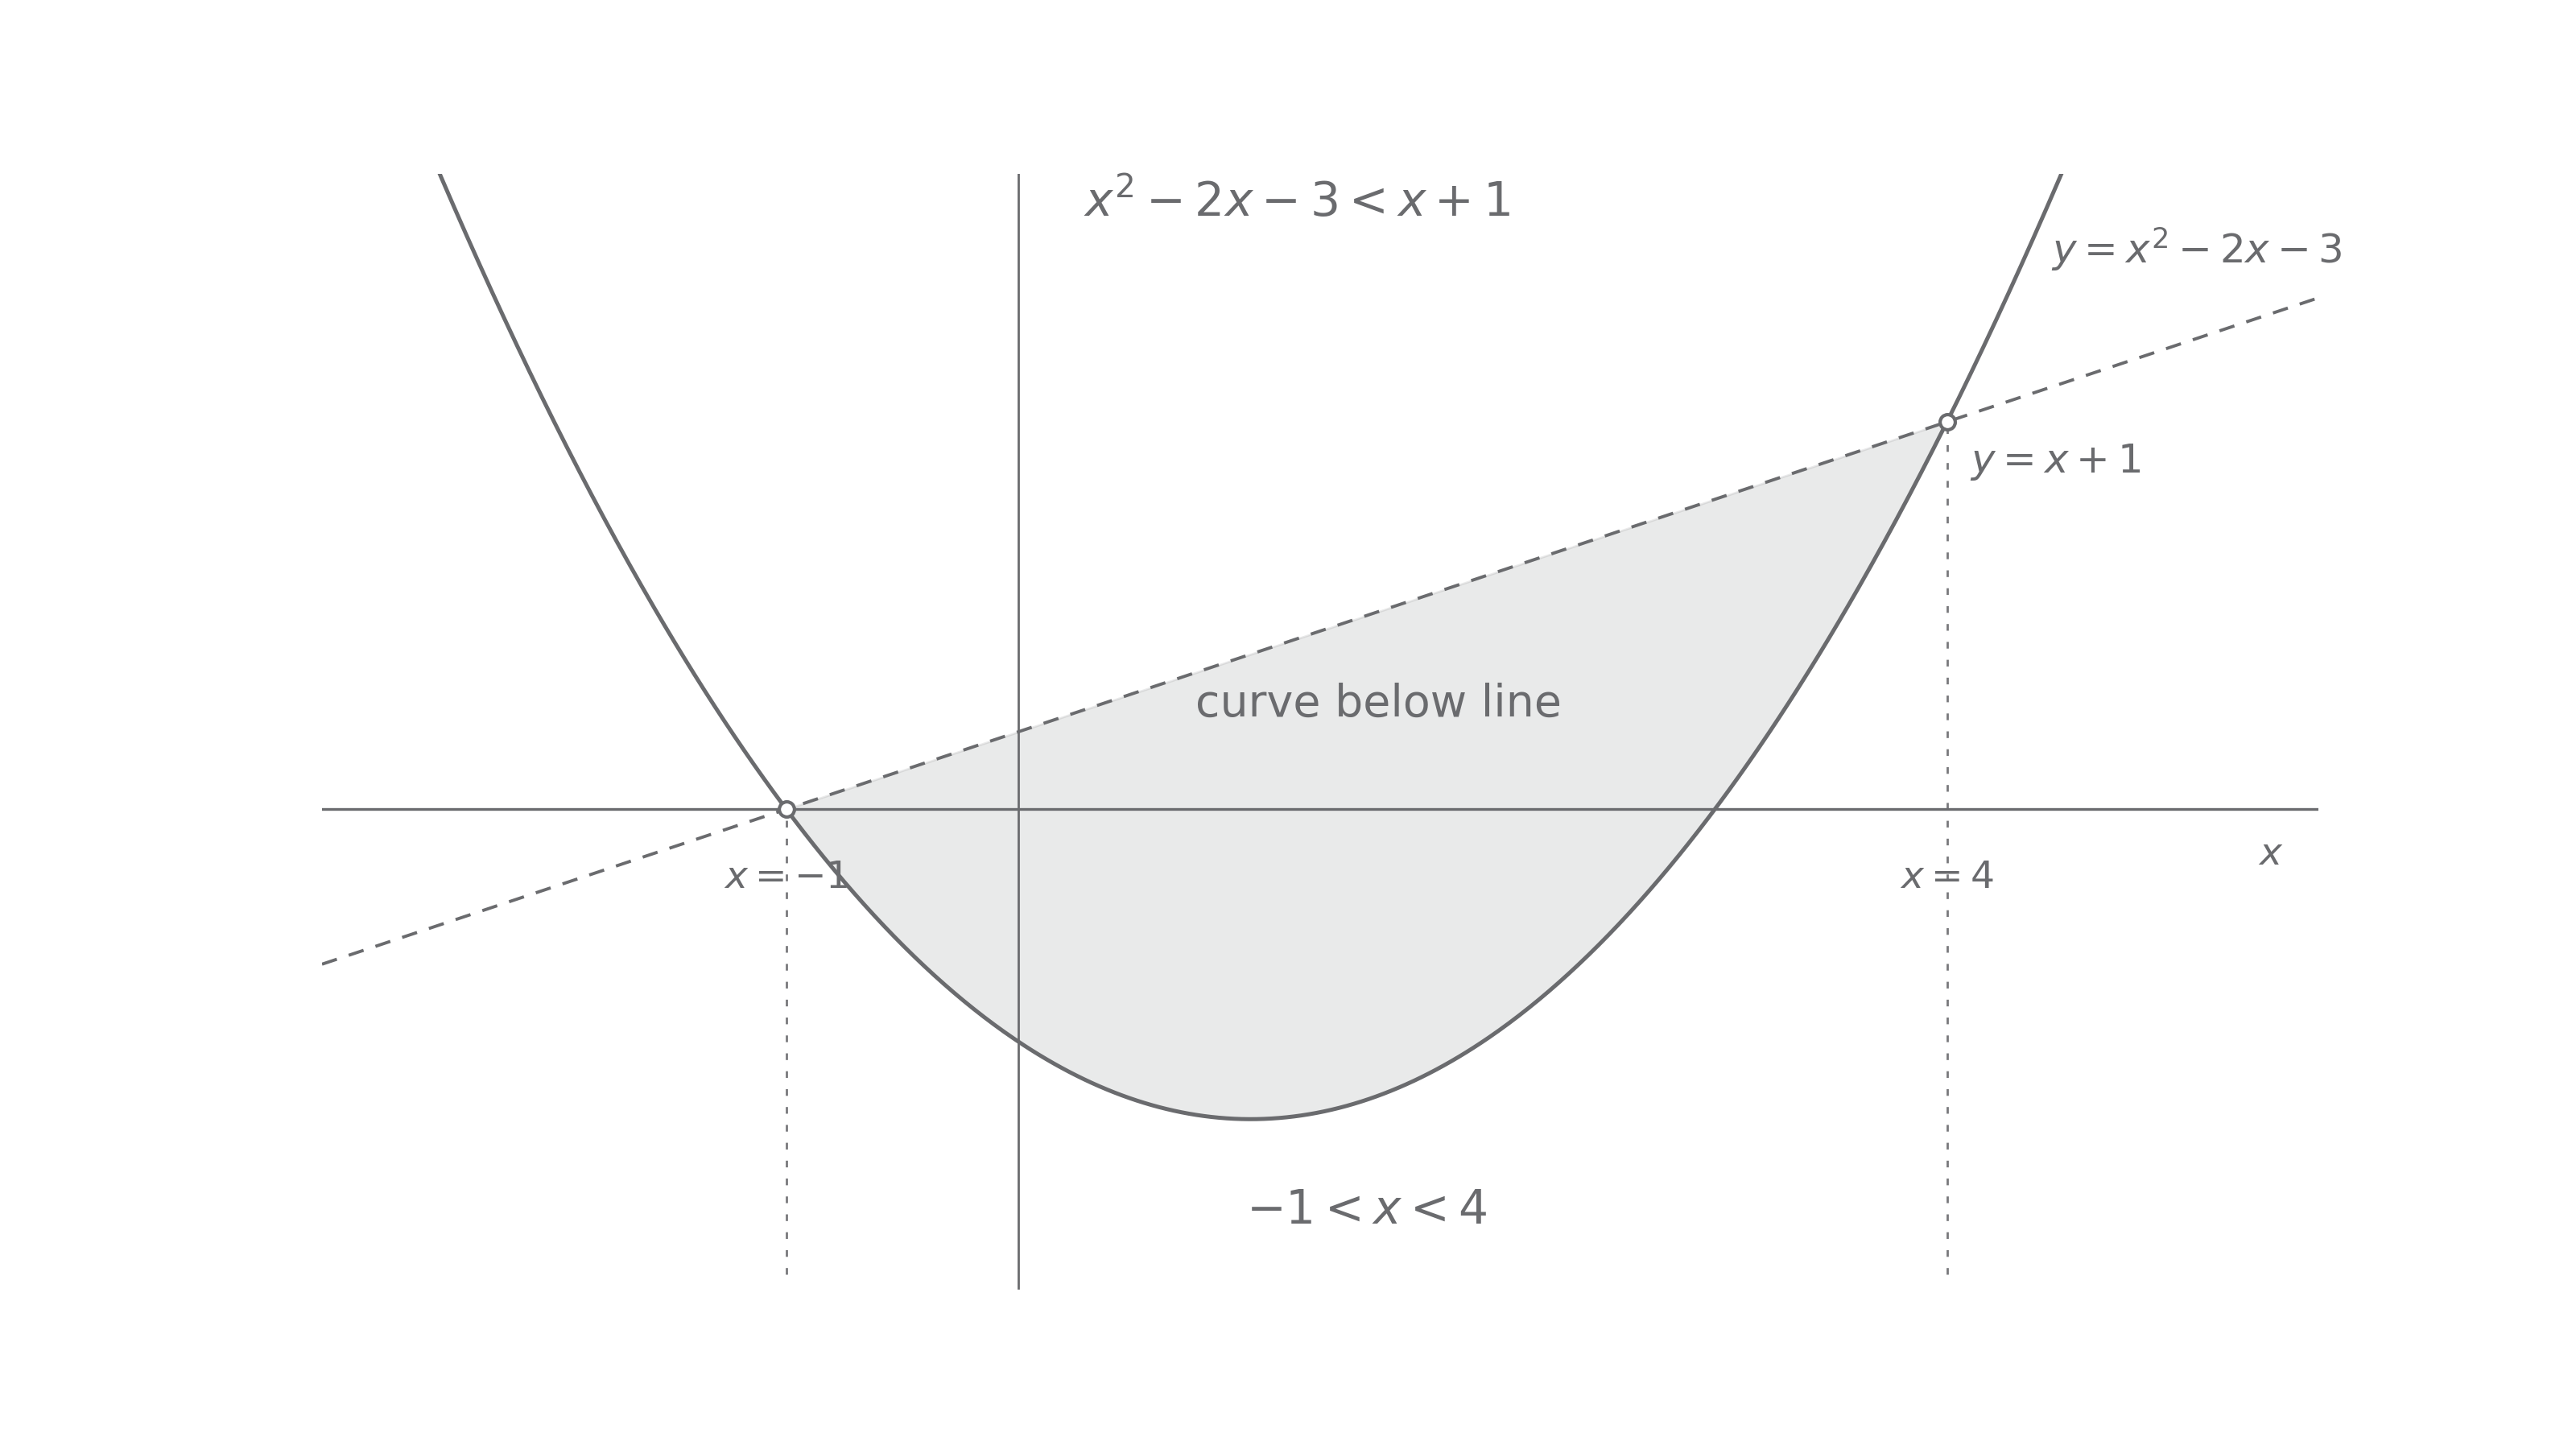
The inequality
can be read in two equivalent ways:
- algebraically, move everything to one side and solve a quadratic inequality;
- graphically, find the values of
xfor which the curve is below the line .
[DIAGRAM: asset_name: Lesson p1.2.5: Solve and interpret linear and quadratic inequalities - diagram 02; asset_slug: p1_2_5_solve_linear_and_quadratic_inequalities_in_a_single_variable_and_interpret_such_inequalities_graphically__diagram_02; recommended_method: drawn_math; description: Draw the curve y=x^2-2x-3 and the dashed line y=x+1 on the same axes. Mark their intersections at x=-1 and x=4, shade the vertical x-range where the curve lies below the line, and label the answer -1<x<4.]
Worked example: solve
Move all terms to the left:
Factorise:
The critical values are and . The quadratic opens upwards, so it is negative between the roots:
Graphically, these are exactly the x-values for which the curve is below the line . The intersection points are boundaries; the strict inequality means they are not included.
Explain It Back
Use this as a self-explanation check after the section above. It is for diagnosing what you can already explain, not for learning new material from scratch.
This is a common place to confuse below the line with negative. The curve can be below the line even when both y-values are positive. The comparison is between two graphs, so subtracting one side from the other creates the single expression whose sign you test.
Represent inequalities graphically
So far, most graphs have helped us solve inequalities in one variable. Edexcel also expects you to represent inequalities such as
and
as shaded regions in the coordinate plane.
[DIAGRAM: asset_name: Lesson p1.2.5: Solve and interpret linear and quadratic inequalities - diagram 03; asset_slug: p1_2_5_solve_linear_and_quadratic_inequalities_in_a_single_variable_and_interpret_such_inequalities_graphically__diagram_03; recommended_method: drawn_math; description: Draw two side-by-side coordinate panels. Left panel: dashed boundary line y=x+1 with the region above shaded and labelled y>x+1. Right panel: solid boundary parabola y=x^2-2x-2 with the region above shaded and labelled y>=x^2-2x-2. Include direct labels for dotted boundary, solid boundary, and shade above.]
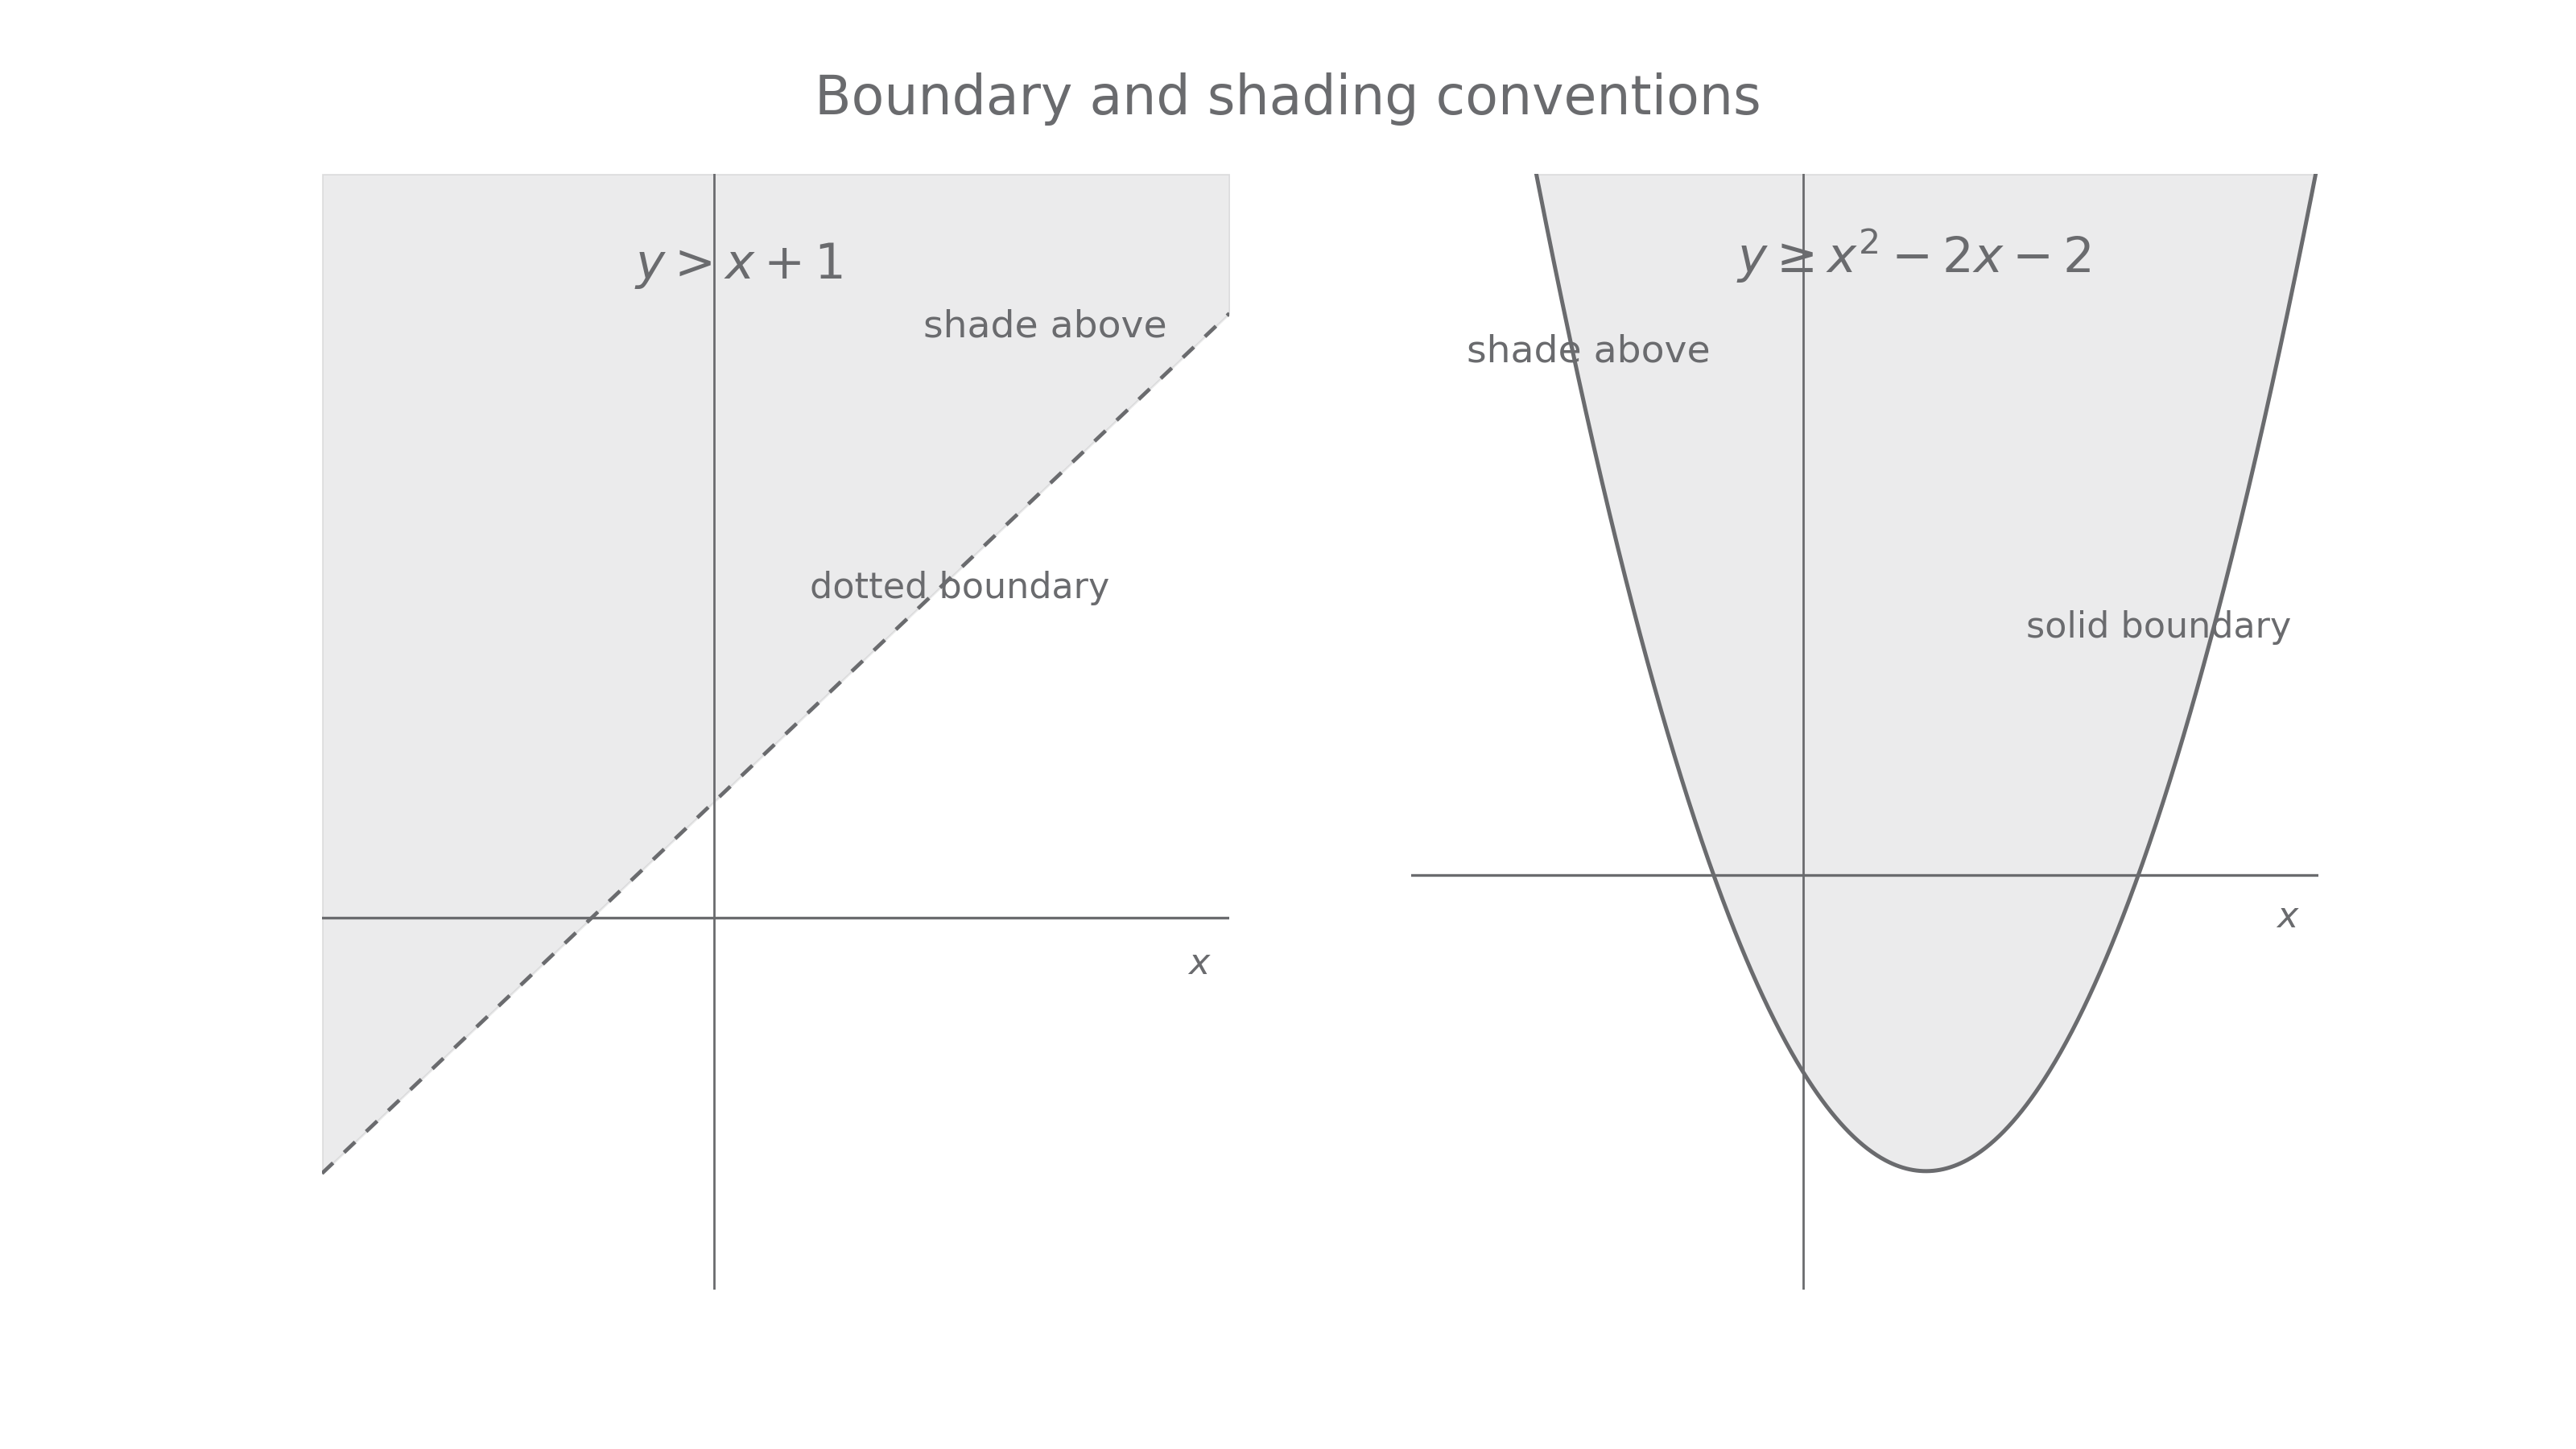
The boundary is the graph you would get by replacing the inequality sign with =. Then:
- use a dotted boundary for strict inequalities
<or>; - use a solid boundary for inclusive inequalities
<=or>=; - shade above the boundary for
y > ...ory >= ...; - shade below the boundary for
y < ...ory <= ....
If you are unsure which side to shade, test a point not on the boundary. For , try :
is false, so the side containing the origin is not the solution region. The other side is shaded.
Represent inequalities graphically Continued
For one-variable answers, use number-line language: x < a, c < x < d, or unions of intervals. For two-variable graphical inequalities, use shaded regions in the plane. Both are solution sets; they just live in different spaces.