P1.2.7 - Graphs of functions and the modulus graph
A graph is a picture of how a function behaves. In this lesson you will learn how to read the important features of polynomial, modulus, reciprocal, and proportional graphs, then use those features to solve equations and inequalities. The aim is not to draw perfect artwork: it is to produce sketches accurate enough to show roots, intercepts, asymptotes, intersections, and the meaning of a solution.
Sketching simple polynomial graphs
For a graph y=f(x), the x-intercepts are the values of x where f(x)=0. These are also called roots of the equation f(x)=0. A sketch of a simple polynomial should show the roots, the y-intercept, and the rough end behaviour.
If a polynomial is in factorised form, the factors tell you the x-intercepts directly:
The power of a factor tells you how the graph behaves at that root.
| Factor near a root | Graph behaviour at that root |
|---|---|
odd power, such as (x-r) or (x-r)^3 | crosses the x-axis |
even power, such as (x-r)^2 or (x-r)^4 | touches the x-axis and turns back |
The leading term controls the far-left and far-right ends. A positive cubic goes down on the left and up on the right. A positive quartic goes up at both ends. A negative leading coefficient reflects those end behaviours in the x-axis.
[DIAGRAM: asset_name: Lesson p1.2.7: Graphs of functions, polynomial curves, and the modulus graph - diagram 01; asset_slug: p1_2_7_understand_and_use_graphs_of_functions_including_functions_defined_by_simple_polynomials_and_the_modulus_graph__diagram_01; recommended_method: drawn_math; description: Draw two clean coordinate panels. Left panel: sketch the cubic y=(x+2)(x-1)(x-3), crossing the x-axis at x=-2, x=1, and x=3, with left end down and right end up. Right panel: sketch the quartic y=x^2(2x-1)^2, touching the x-axis at x=0 and x=1/2, with both ends up. Label roots, crossing/touching behaviour, and axes.]
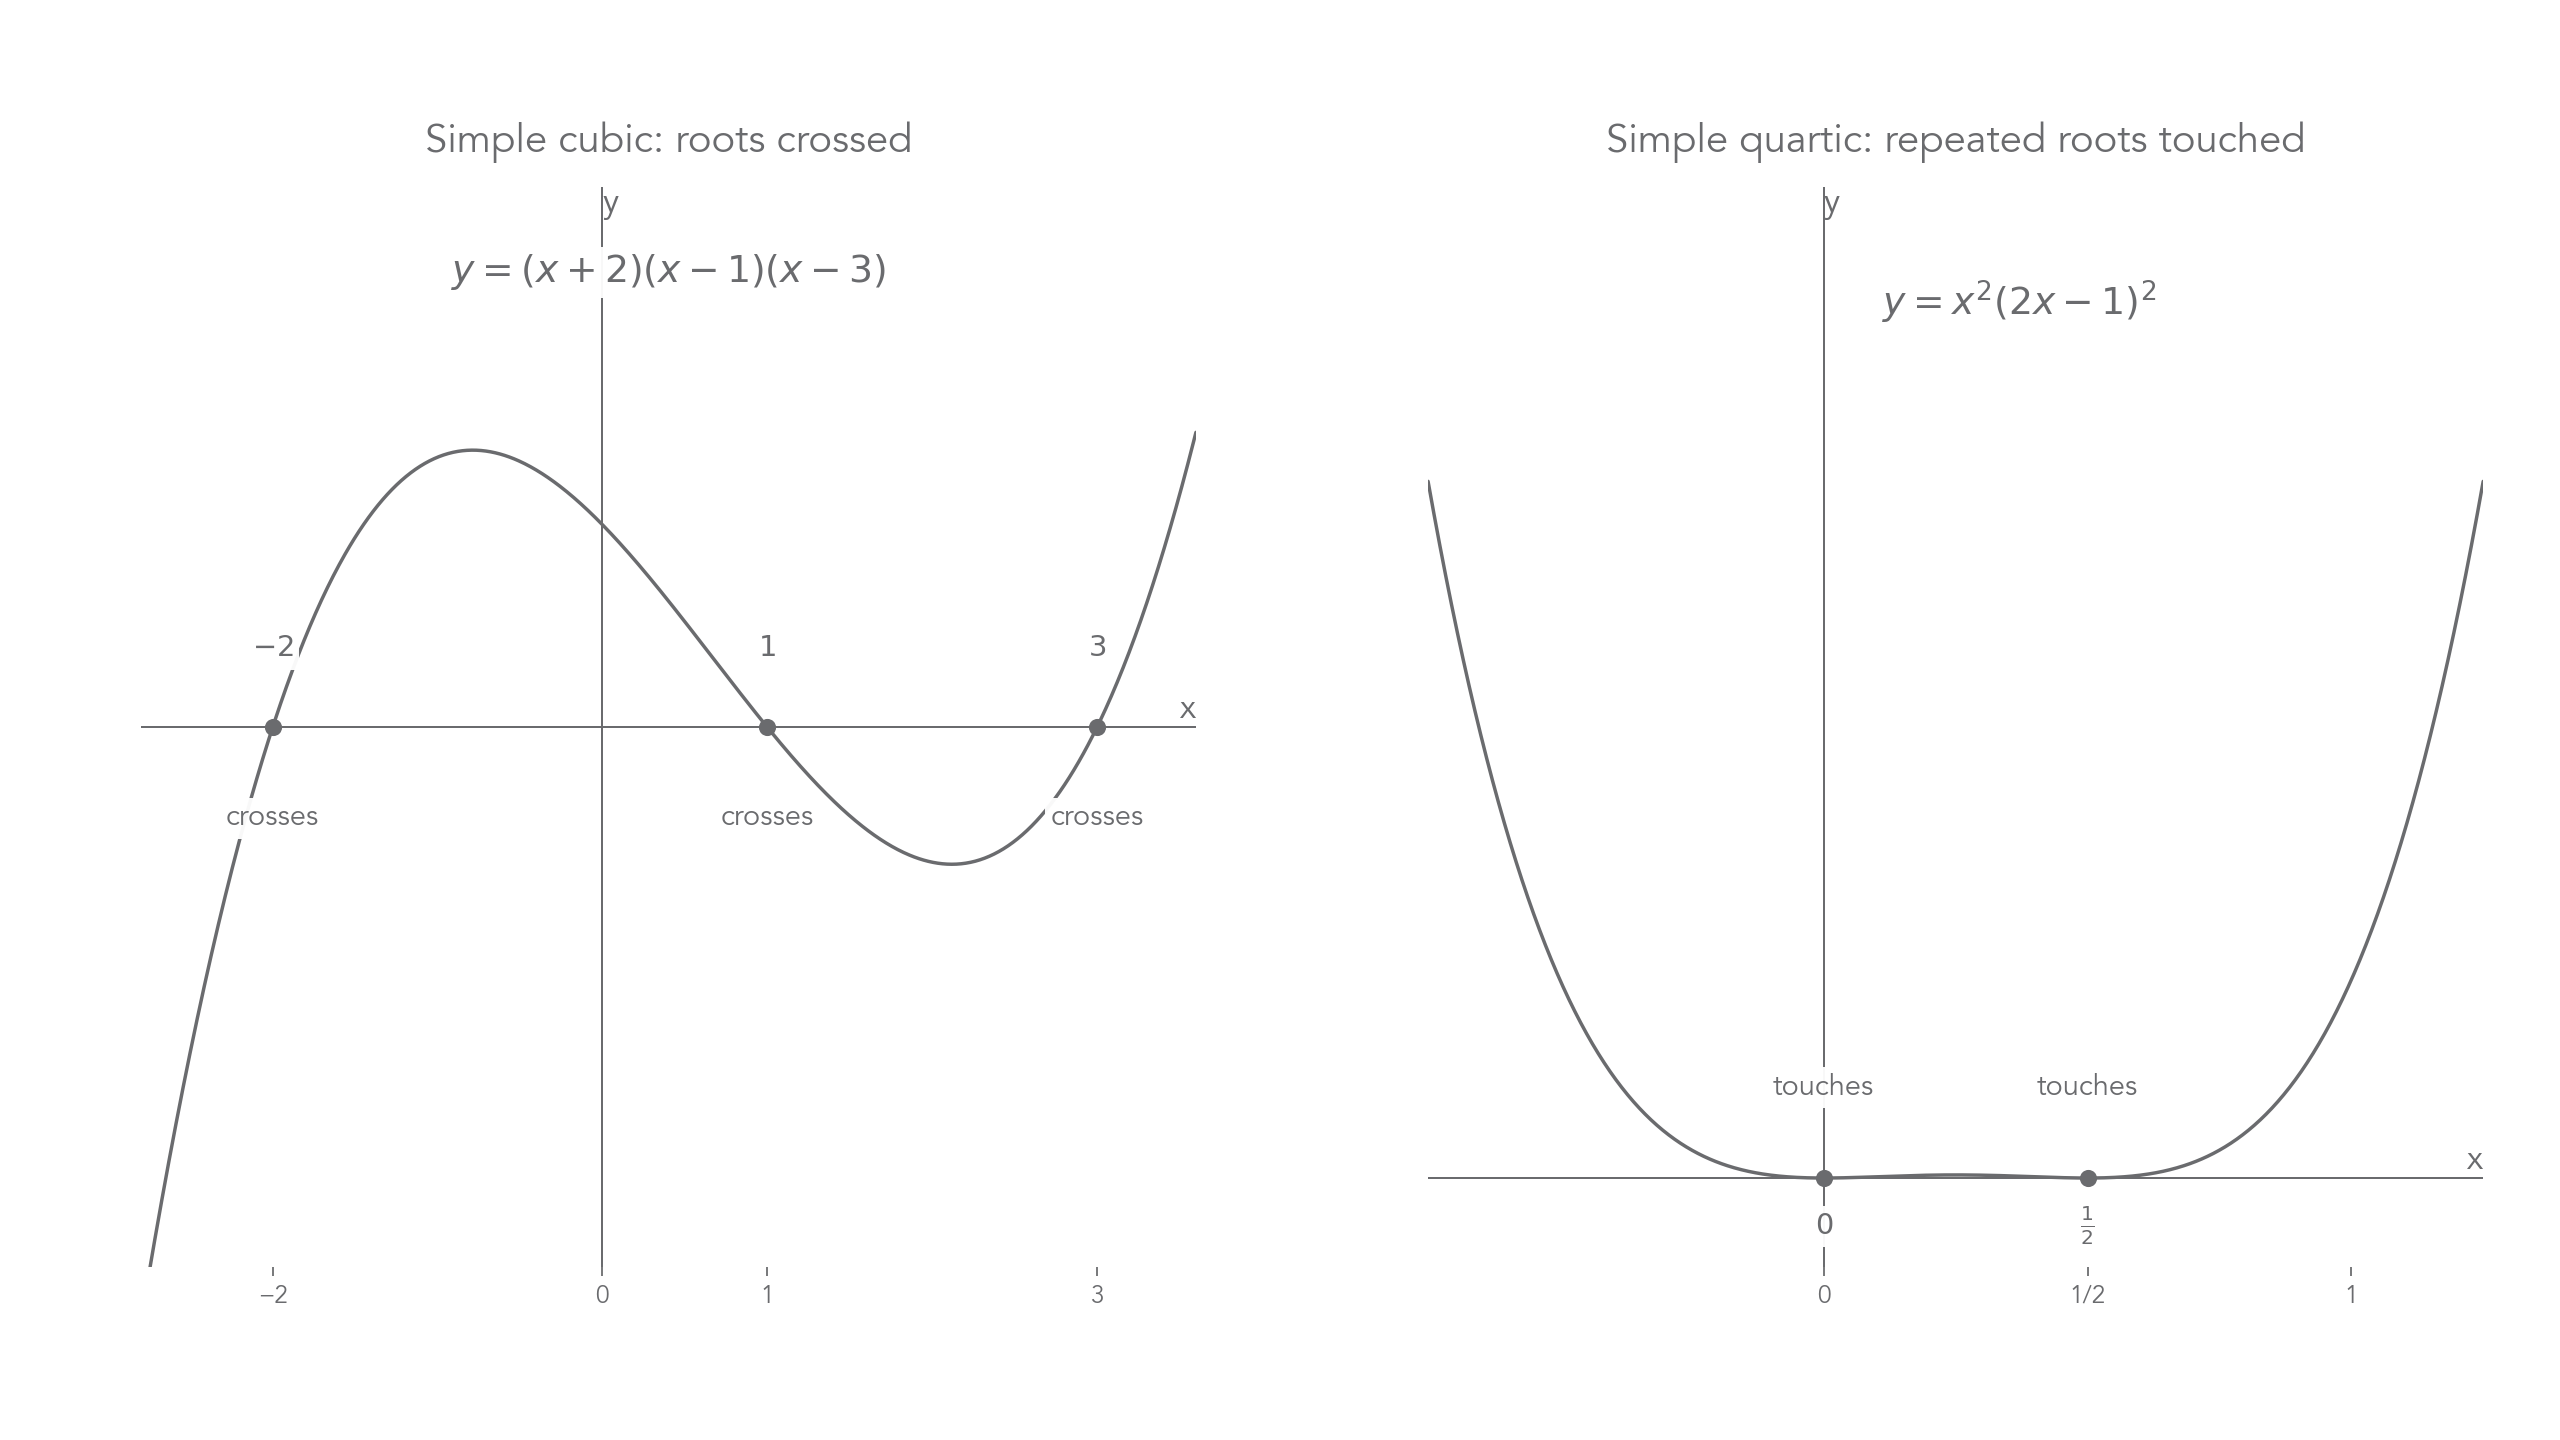
Worked example: sketch the important features of
First find the roots:
So
giving roots
Both roots come from squared factors, so the graph touches the x-axis at both roots rather than crossing it. The leading term is
so the graph is a positive quartic and both ends go upwards. Also, because the expression is a product of two squares, y is never negative.
So the sketch should show:
- x-intercepts at
(0,0)and(1/2,0) - the graph touching the x-axis at both intercepts
- both ends rising
- the whole graph on or above the x-axis
This is enough for an Edexcel-style sketch. You do not need exact turning points unless the question asks for them or they are obvious from the expression.
The modulus of a linear function
The modulus of a number is its non-negative value. For example, |5|=5 and |-5|=5. In graph work, the key idea is that y=|ax+b|, with a != 0, is made from the straight line y=ax+b by reflecting any part below the x-axis up into the x-axis.
Linear modulus graph
For a linear expression ax+b,
For a != 0, the graph y=|ax+b| is a V-shaped graph with vertex where ax+b=0.
Worked example: sketch and use
Start with the line y=2x-1. It crosses the x-axis when
So the modulus graph has vertex (1/2,0). For x >= 1/2, the expression 2x-1 is already non-negative, so the right branch is
For x < 1/2, the expression 2x-1 is negative, so the left branch is
[DIAGRAM: asset_name: Lesson p1.2.7: Graphs of functions, polynomial curves, and the modulus graph - diagram 02; asset_slug: p1_2_7_understand_and_use_graphs_of_functions_including_functions_defined_by_simple_polynomials_and_the_modulus_graph__diagram_02; recommended_method: drawn_math; description: Draw the V-shaped graph y=|2x-1| with vertex (1/2,0) and y-intercept (0,1). On the same axes draw the line y=x. Mark and label the intersection x-values x=1/3 and x=1. Use a subtle thicker style on the parts of the modulus graph above the line y=x, labelled |2x-1| > x, corresponding to x<1/3 and x>1. Axes labelled x and y.]
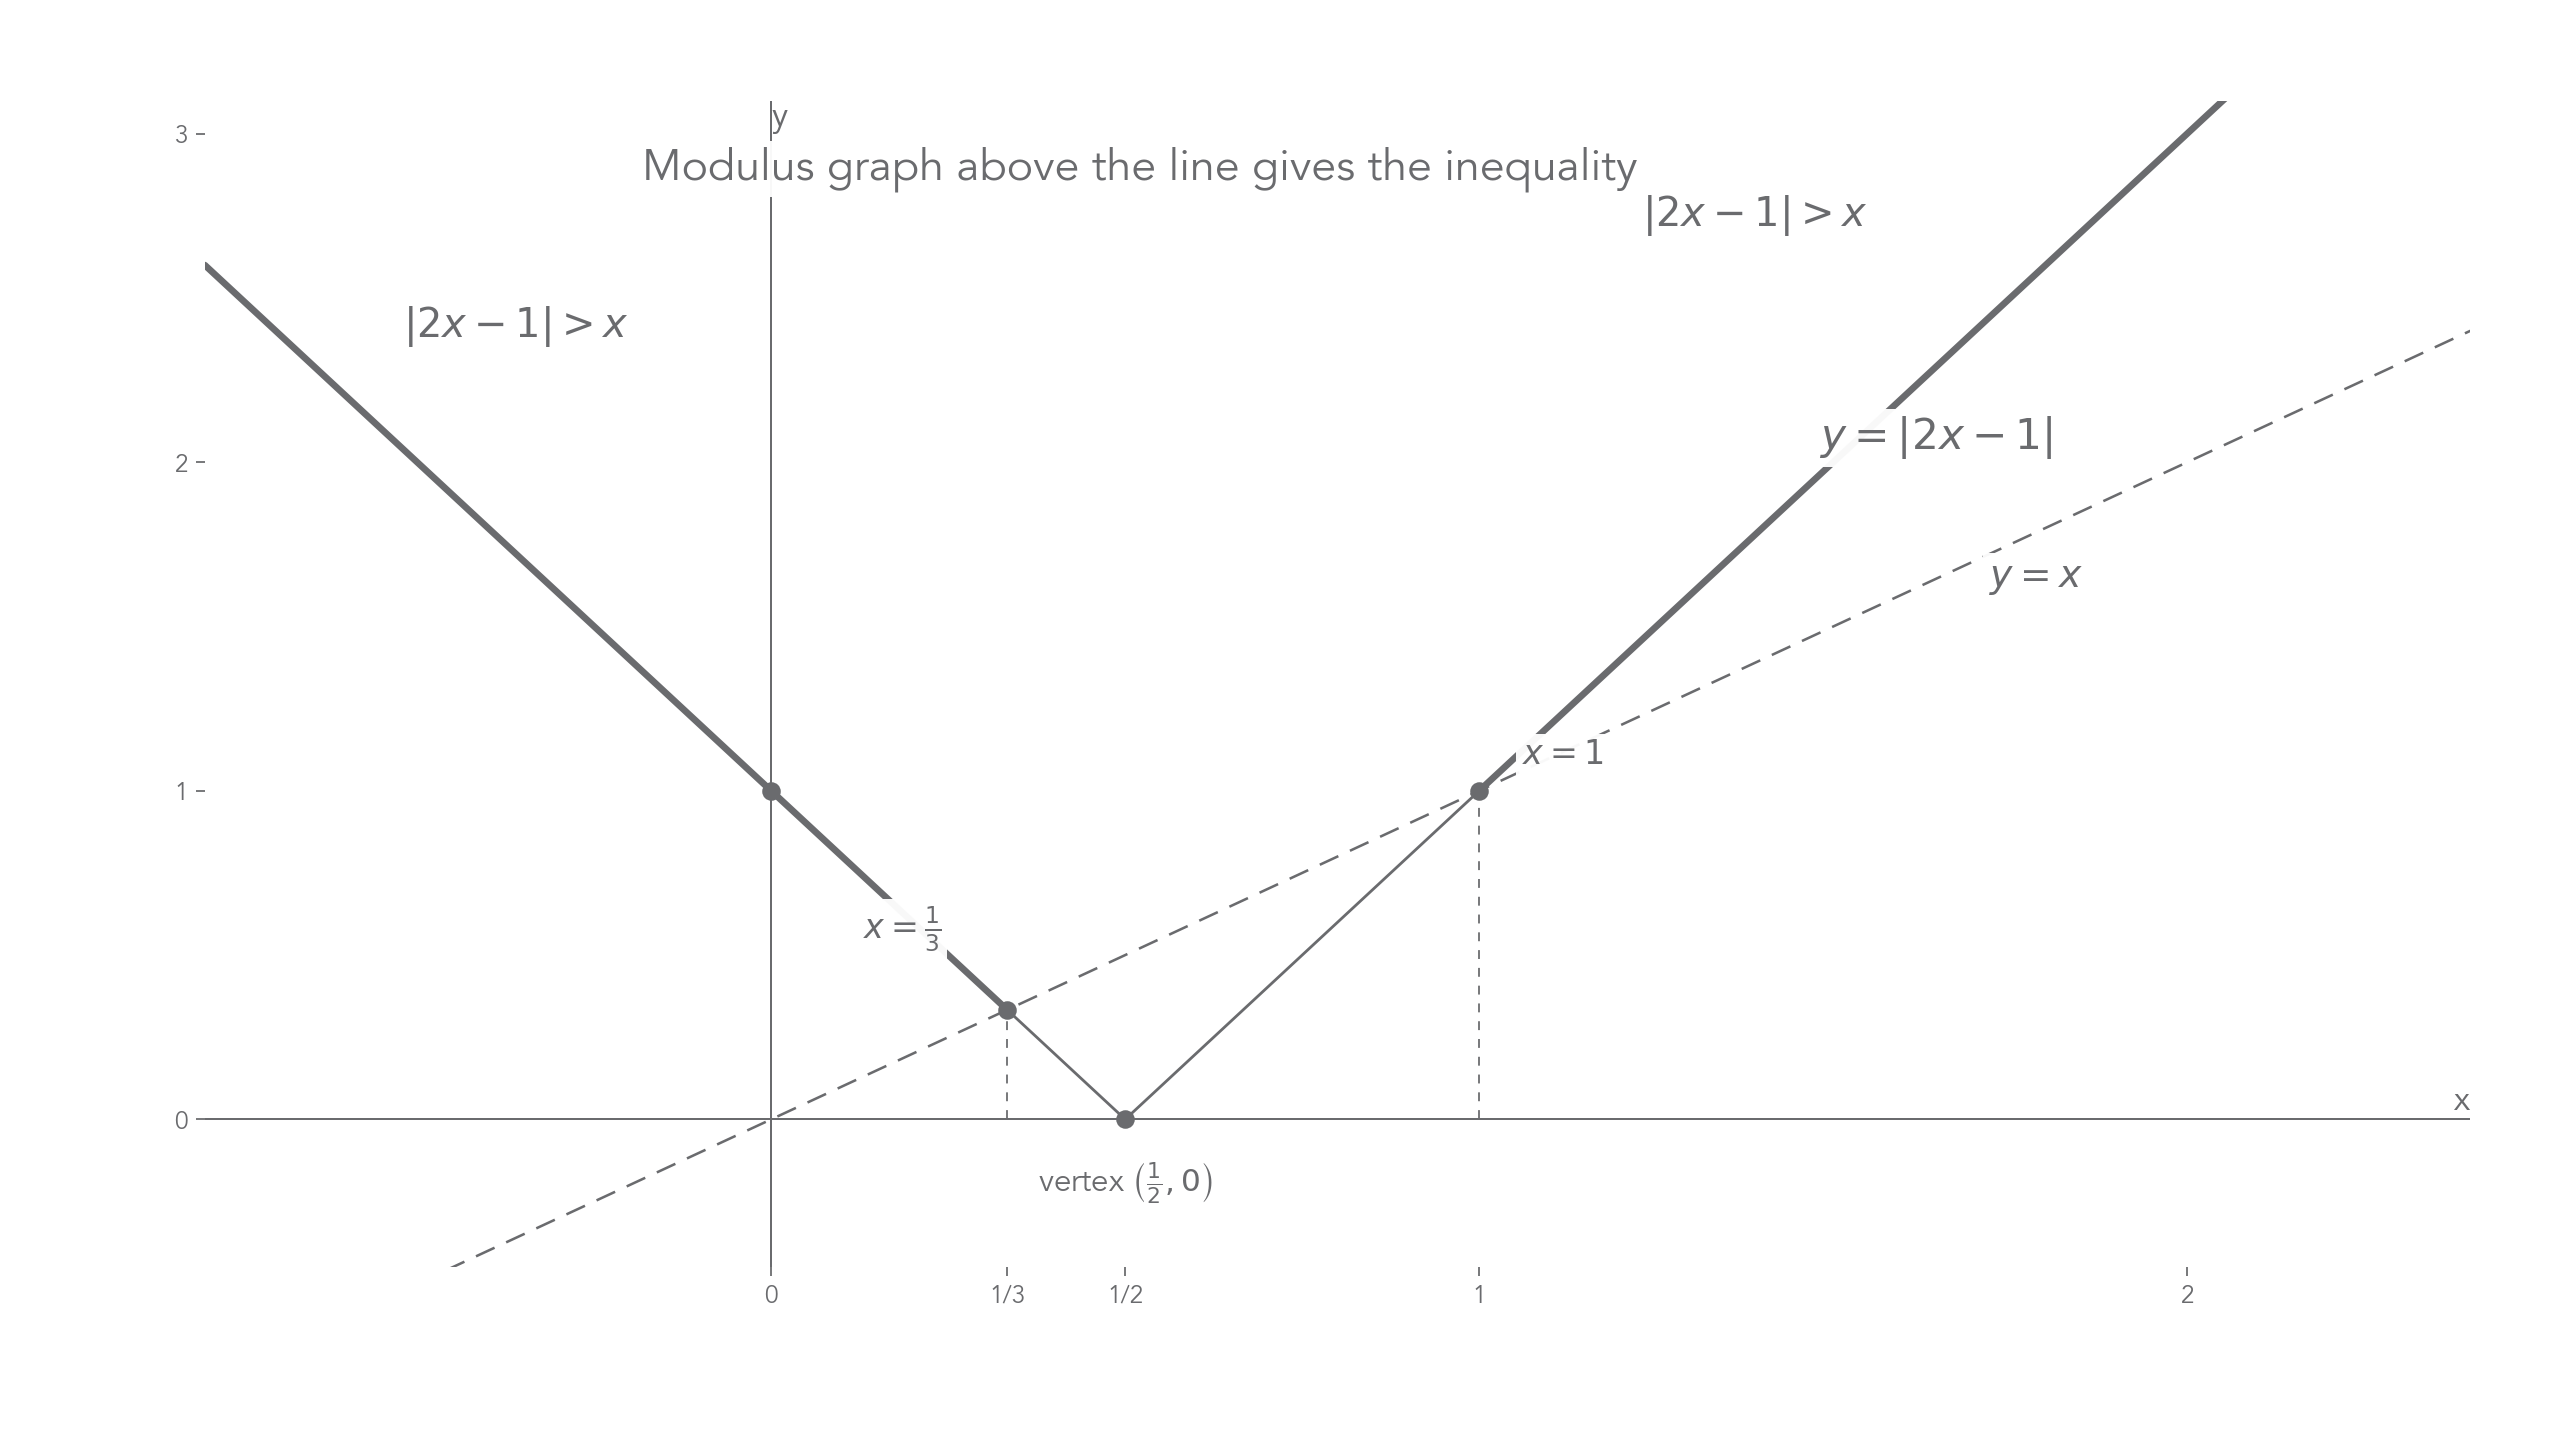
Now use the graph to solve
The solutions are the x-coordinates where the V-shaped graph meets the line y=x. Algebraically, use the two branches.
For x < 1/2:
This is valid because 1/3 < 1/2.
For x >= 1/2:
This is valid because 1 >= 1/2.
So
The graph also solves the inequality
This means the modulus graph is above the line y=x. From the graph, that happens for
Notice the strict inequality: the intersection points themselves are not included.
Reciprocal graphs and asymptotes
The graphs
have two important lines called asymptotes. An asymptote is a line that the graph approaches. For these basic reciprocal graphs, the vertical asymptote is x=0 and the horizontal asymptote is y=0.
These are also proportion graphs. The form represents inverse proportion, because is constant. The form represents inverse-square proportion, because is constant. That is why this section will connect naturally with proportional relationships later.
For y=a/x, the sign of a decides which diagonal pair of regions the branches occupy. If a>0, the branches are in quadrants I and III. If a<0, the branches are in quadrants II and IV.
For y=a/x^2, the denominator is always positive except at x=0, where the expression is undefined. So if a>0, both branches lie above the x-axis; if a<0, both lie below it.
[DIAGRAM: asset_name: Lesson p1.2.7: Graphs of functions, polynomial curves, and the modulus graph - diagram 03; asset_slug: p1_2_7_understand_and_use_graphs_of_functions_including_functions_defined_by_simple_polynomials_and_the_modulus_graph__diagram_03; recommended_method: drawn_math; description: Draw three small coordinate panels. Panel 1: y=2/x with asymptotes x=0 and y=0, branches in quadrants I and III. Panel 2: y=2/x^2 with asymptotes x=0 and y=0, both branches above the x-axis. Panel 3: y=2/(x+1)+1 with dashed asymptotes x=-1 and y=1, showing the shifted reciprocal shape. Label each equation and each asymptote.]
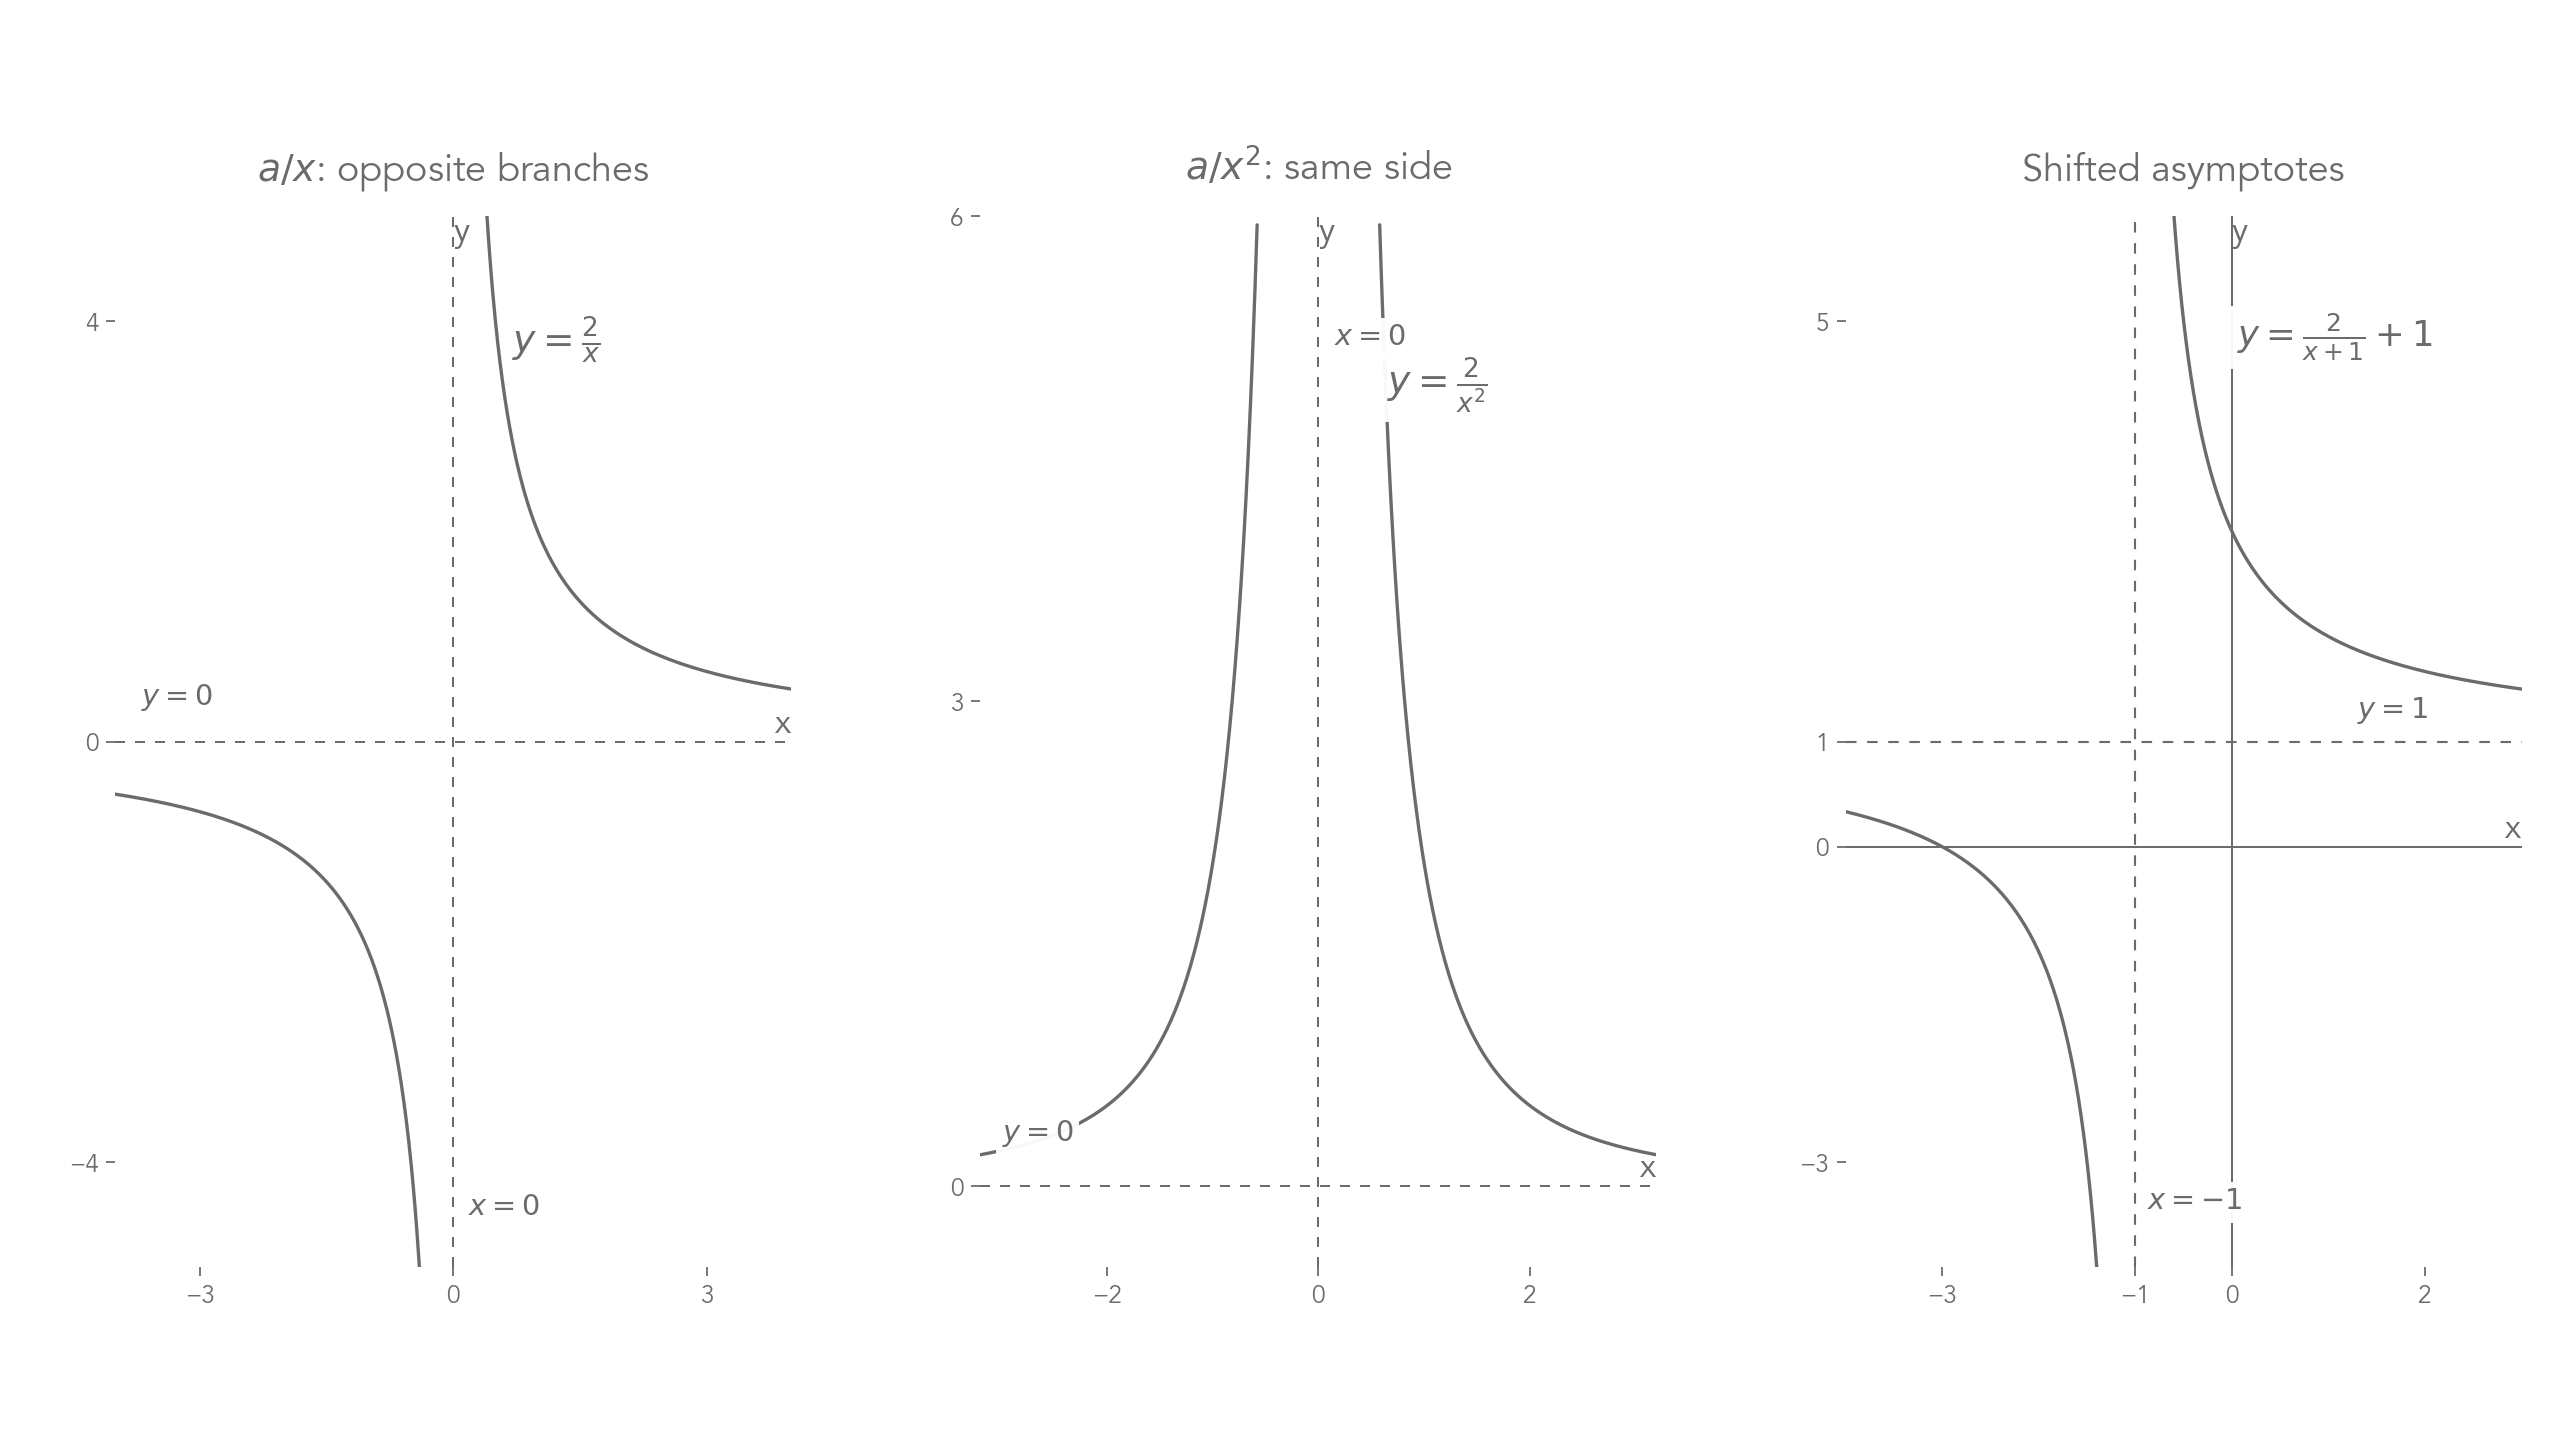
The shifted form in this spec point is
The denominator is zero when
so the vertical asymptote is
As x becomes very large positive or very large negative, the fraction a/(x+p) gets close to zero, so the horizontal asymptote is
Worked example: state the asymptotes and key shape of
The denominator is zero when x+2=0, so the vertical asymptote is
The graph is a shifted version of y=3/x, moved left 2 and down 1, so the horizontal asymptote is
Because the numerator is positive, the branches sit in the top-right and bottom-left regions relative to the centre point where the asymptotes cross, (-2,-1).
Intersections as solutions
Graphs turn equations into meeting points. If you solve
you are finding the x-coordinates where the graphs
intersect.
This is why a sketch is useful even when the final solution is algebraic. The algebra gives exact values; the graph tells you how many values to expect, where they are roughly, and how to interpret inequalities.
Worked example: interpret and solve
Graphically, this asks where
meets
Algebraically, bring all terms to one side:
Factorise:
So
These are the three x-coordinates of the intersection points. If the question asked for the full coordinates, you would substitute each x-value into either graph to find the matching y-value.
For inequalities, use vertical position:
means the graph y=f(x) is above the graph y=g(x).
means the graph y=f(x) is below the graph y=g(x).
Proportional relationships and their graphs
The proportion symbol says that one variable is a constant multiple of another expression. The expression might be , but it might also be , , or . To turn proportion notation into an equation, replace with times the expression, where is the constant of proportionality.
For direct proportion,
means
where is the constant of proportionality.
Proportional relationship
is proportional to an expression in if times that expression for some constant . For example, , , , and become , , , and .
[DIAGRAM: asset_name: Lesson p1.2.7: Graphs of functions, polynomial curves, and the modulus graph - diagram 04; asset_slug: p1_2_7_understand_and_use_graphs_of_functions_including_functions_defined_by_simple_polynomials_and_the_modulus_graph__diagram_04; recommended_method: drawn_math; description: Draw two coordinate panels. Left panel: a direct proportion graph y=kx as a straight line through the origin, with a marked point (x,y) and a label gradient k. Right panel: a straight line y=kx+c with c not equal to 0, labelled linear but not directly proportional because it does not pass through the origin. Use this as a misconception contrast. Axes labelled x and y.]
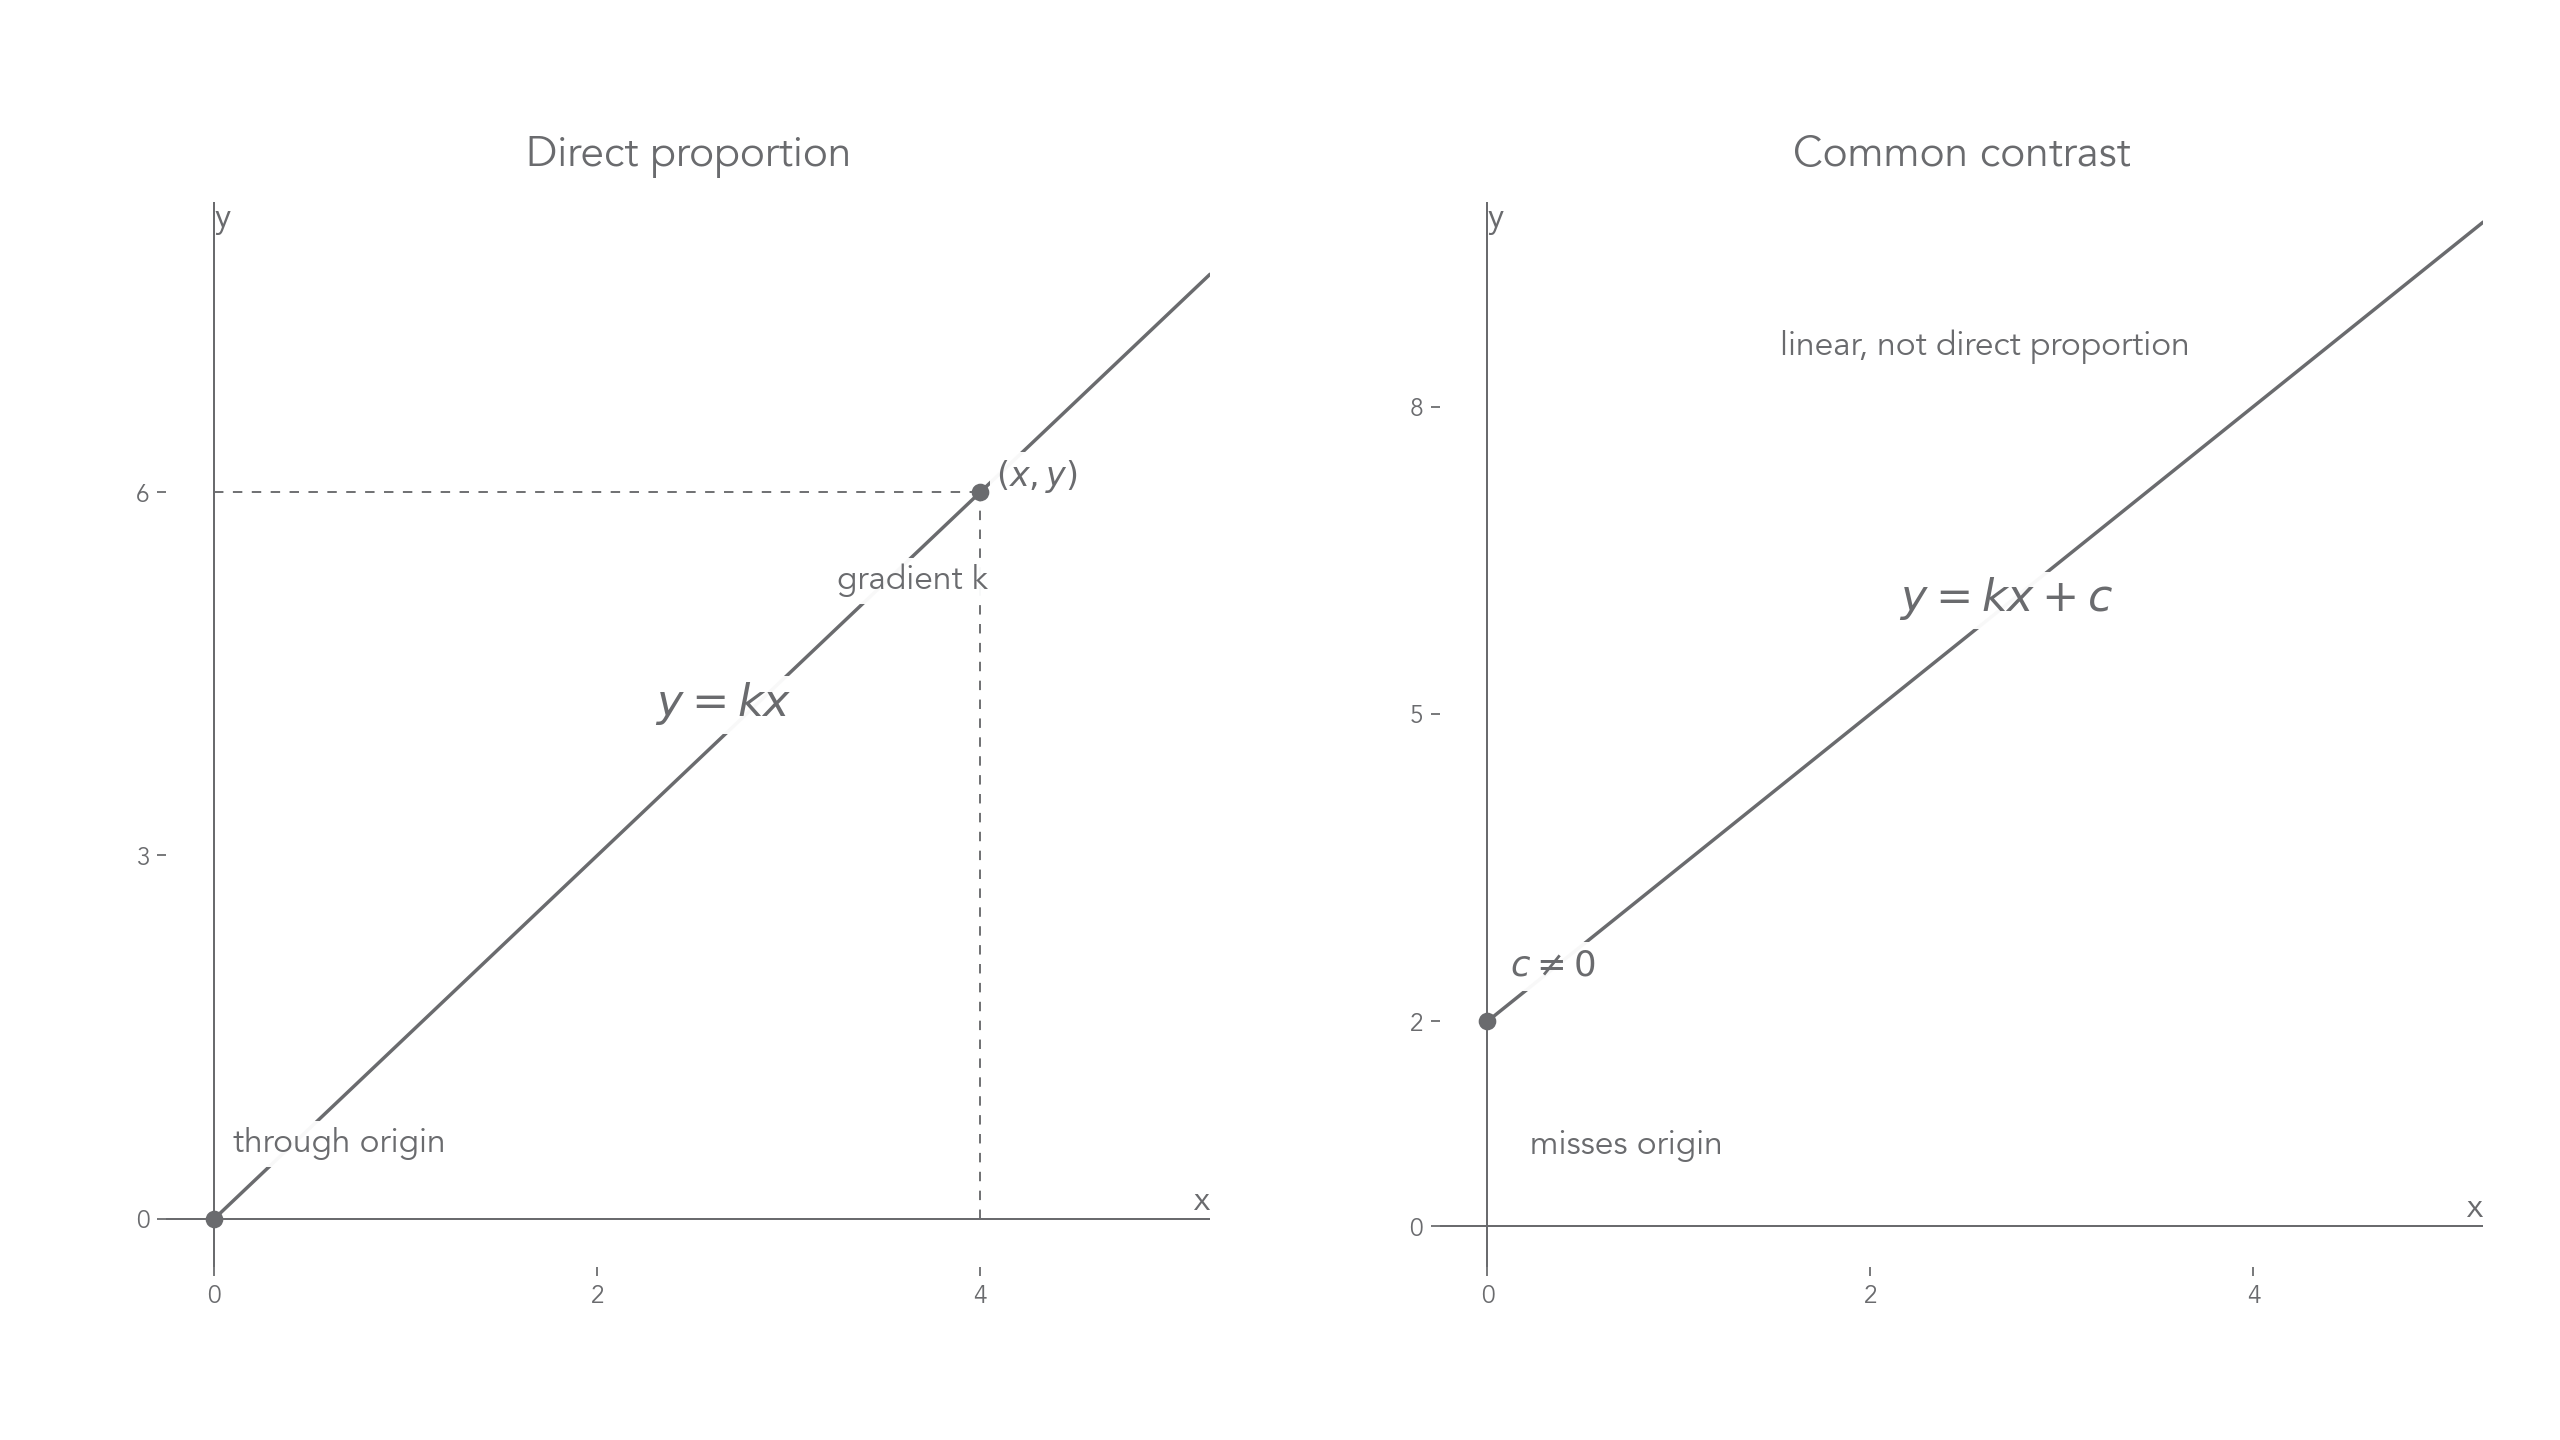
The graph shape comes from the expression after the proportion symbol:
| Proportion statement | Equation with constant | Graph type |
|---|---|---|
| straight line through the origin | ||
| quadratic graph; for , a parabola opening upwards | ||
| reciprocal graph with axes as asymptotes | ||
| reciprocal-square graph with axes as asymptotes |
So the reciprocal graphs you met earlier are not a separate idea from proportion: is an inverse proportional relationship, and is an inverse-square proportional relationship. A direct power such as links back to polynomial graph shapes instead.
Worked example: is directly proportional to . When , . Find the relationship between and , and describe the graph of against .
Since is directly proportional to ,
Use the given pair:
So
The graph of against is a straight line through the origin with gradient .
This "through the origin" condition matters. A graph such as is a straight line, but it is not a direct proportion graph because is not constant and the line does not pass through .
Worked example: is inversely proportional to . When , . Find the equation for in terms of , and identify the graph type.
Since ,
Use the given pair:
So
This is a reciprocal-square graph: it has vertical asymptote and horizontal asymptote . Because , both branches lie above the x-axis.
Choosing the right graph clues
A good graph sketch is built from the features that matter for the function type.
| Function or relationship | First features to check |
|---|---|
| simple polynomial | roots, repeated roots, y-intercept, end behaviour |
| linear modulus `y= | ax+b |
reciprocal a/x, a/x^2, or a/(x+p)+q | vertical and horizontal asymptotes, branch positions |
equation f(x)=g(x) | intersection points of y=f(x) and y=g(x) |
| proportional relationship | convert into an equation with , then match the graph shape: line for , parabola for , reciprocal for , reciprocal-square for |
The common thread is that the graph should answer a mathematical question. A root says where a function equals zero. An intersection says where two functions are equal. A region above another graph says where one expression is greater than another. An asymptote says where a reciprocal or inverse proportion graph is undefined or what value it approaches.