1.2.6 - Price determination
In a market economy, prices do not usually need to be set by a central planner. They emerge from the interaction of demand and supply. This lesson explains how equilibrium is determined, why shortages and surpluses push price back toward equilibrium, and how changes in demand or supply create a new market outcome.
Equilibrium and Market Clearing
The equilibrium point is where the demand curve and supply curve intersect. At this price, the quantity consumers want to buy exactly matches the quantity producers want to sell.
Definition: Equilibrium price/quantity
The price and quantity where demand equals supply.
[DIAGRAM: asset_name: 1.2.6 - Price determination - diagram 1; asset_slug: 1.2.6 - 1; recommended_method: retained_png; description: Retained source diagram supporting 1.2.6 - Price determination; the packaged PNG preserves the original educational visual.]
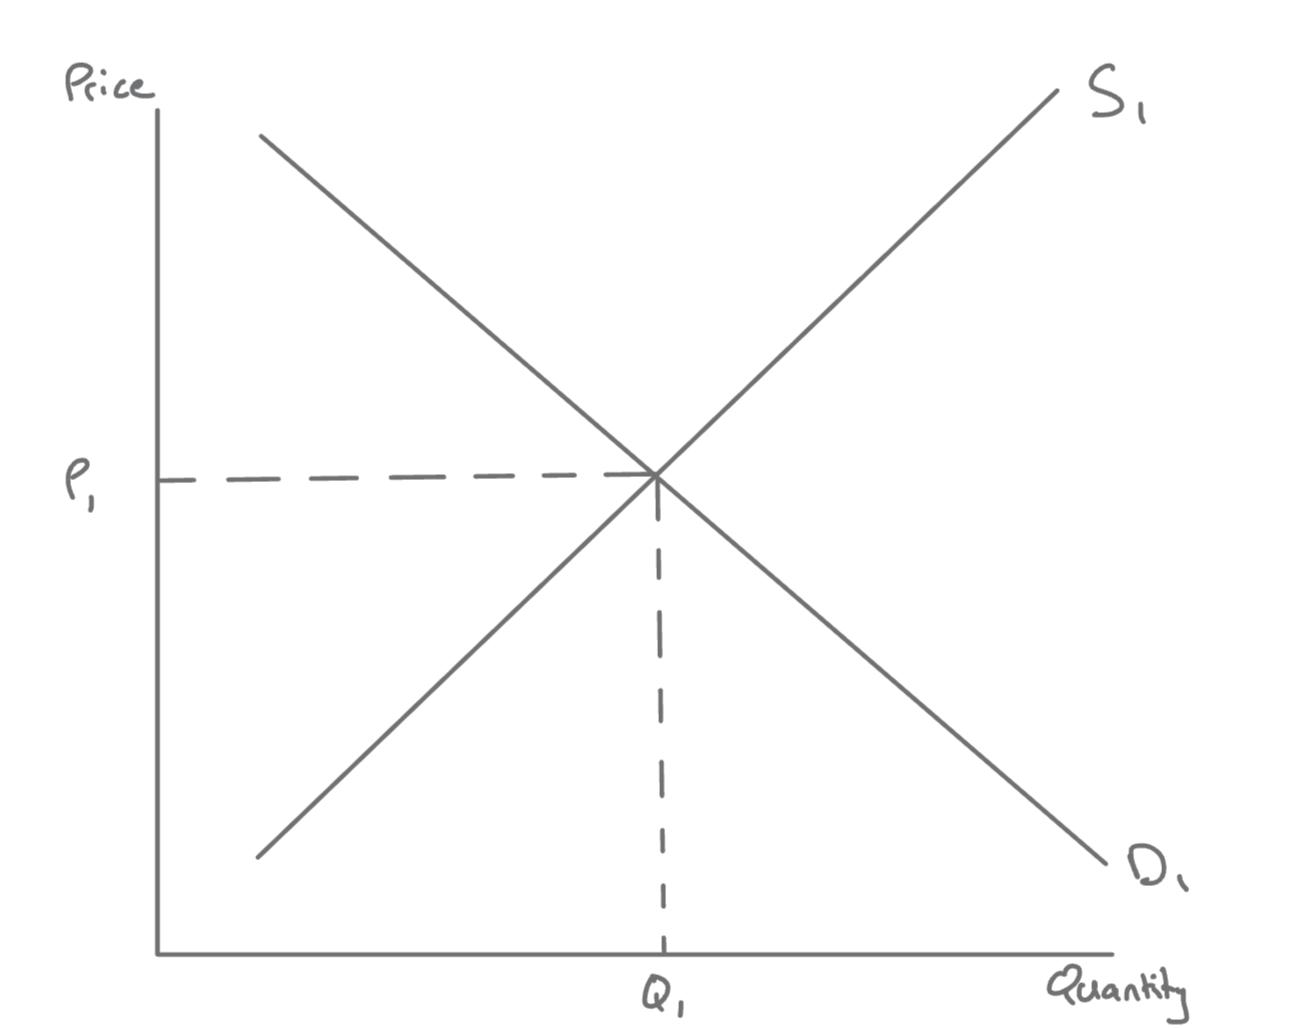
Where D1 and S1 intersect, the market reaches equilibrium at P1 and Q1. Economists often call this the market-clearing price. There is no unsold stock caused by overproduction and no shortage caused by underpricing, so there is no automatic pressure for price to change.
This self-correcting process is part of the price mechanism. Prices act as signals and incentives: they tell buyers and sellers when a good is relatively scarce or relatively plentiful.
Below Equilibrium: Excess Demand
If price is set below equilibrium, the product looks cheap to buyers, so quantity demanded is high. Producers, however, may not be willing or able to supply much at that low price. Quantity demanded becomes greater than quantity supplied.
Definition: Excess demand
Where quantity demanded is greater than quantity supplied at the current price.
[DIAGRAM: asset_name: 1.2.6 - Price determination - diagram 2; asset_slug: 1.2.6 - 2; recommended_method: retained_png; description: Retained source diagram supporting 1.2.6 - Price determination; the packaged PNG preserves the original educational visual.]
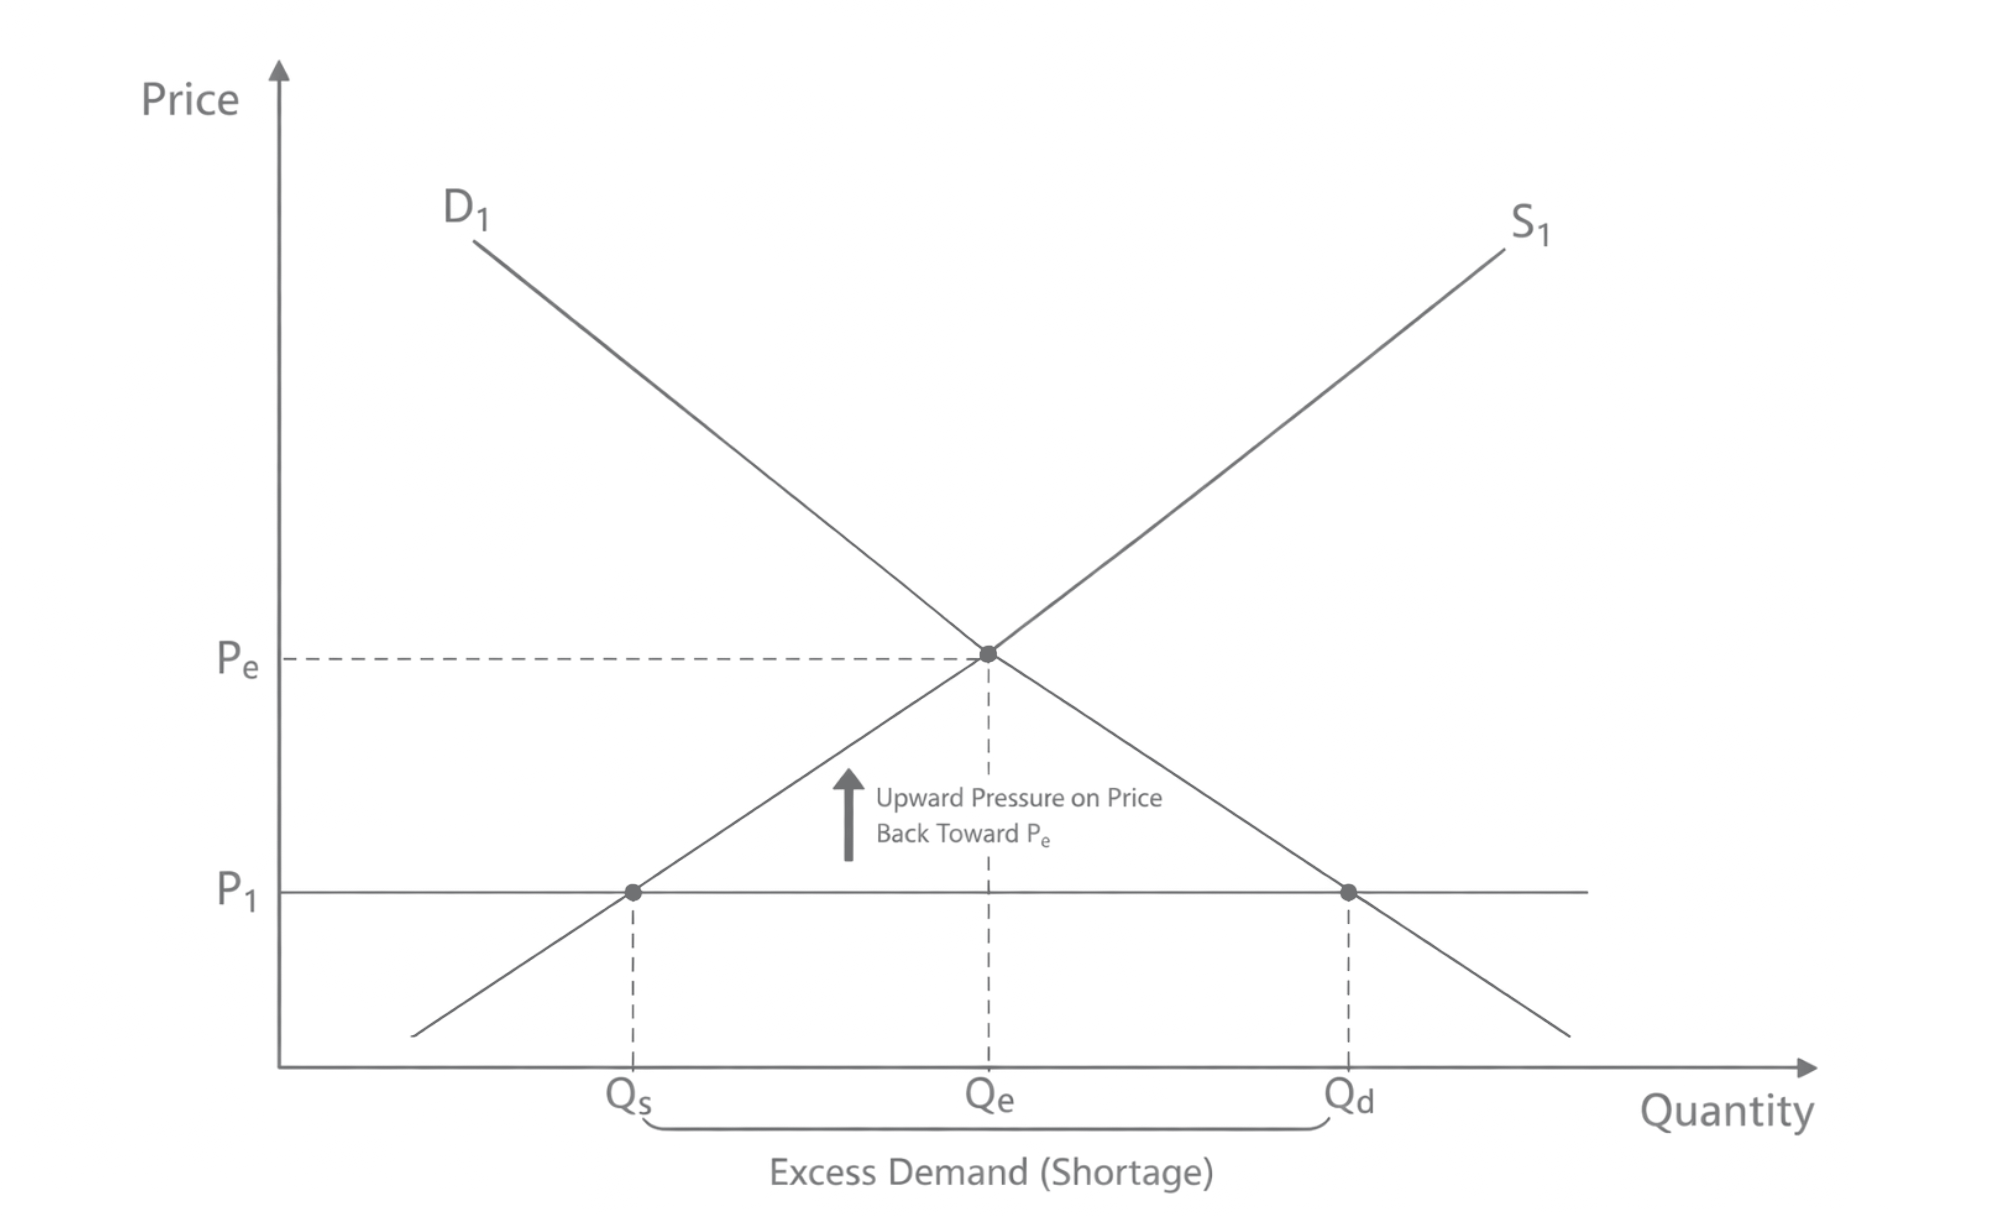
At the below-equilibrium price P1, consumers want to buy Qd but firms supply only Qs, so the gap Qd - Qs is excess demand. As price is bid up toward Pe, the market moves along the same curves: quantity demanded contracts and quantity supplied extends until equilibrium Qe is restored.
That gap is a shortage. Buyers compete for the limited output available, and some are willing to pay more rather than go without. Sellers notice this stronger competition and raise price.
As price rises, two movements happen at the same time:
- quantity demanded contracts
- quantity supplied extends
Those movements continue until the market returns to equilibrium.
In the European gas market in 2022, supply became tight while demand remained strong. With limited gas available, the market experienced strong upward pressure on price because buyers were competing for scarce supply.
Above Equilibrium: Excess Supply
If price is above equilibrium, firms want to sell more than consumers want to buy. At that high price, production looks profitable, but buyers are less willing to purchase the product. Quantity supplied becomes greater than quantity demanded.
Definition: Excess supply
Where quantity supplied is greater than quantity demanded at the current price.
[DIAGRAM: asset_name: 1.2.6 - Price determination - diagram 3; asset_slug: 1.2.6 - 3; recommended_method: retained_png; description: Retained source diagram supporting 1.2.6 - Price determination; the packaged PNG preserves the original educational visual.]
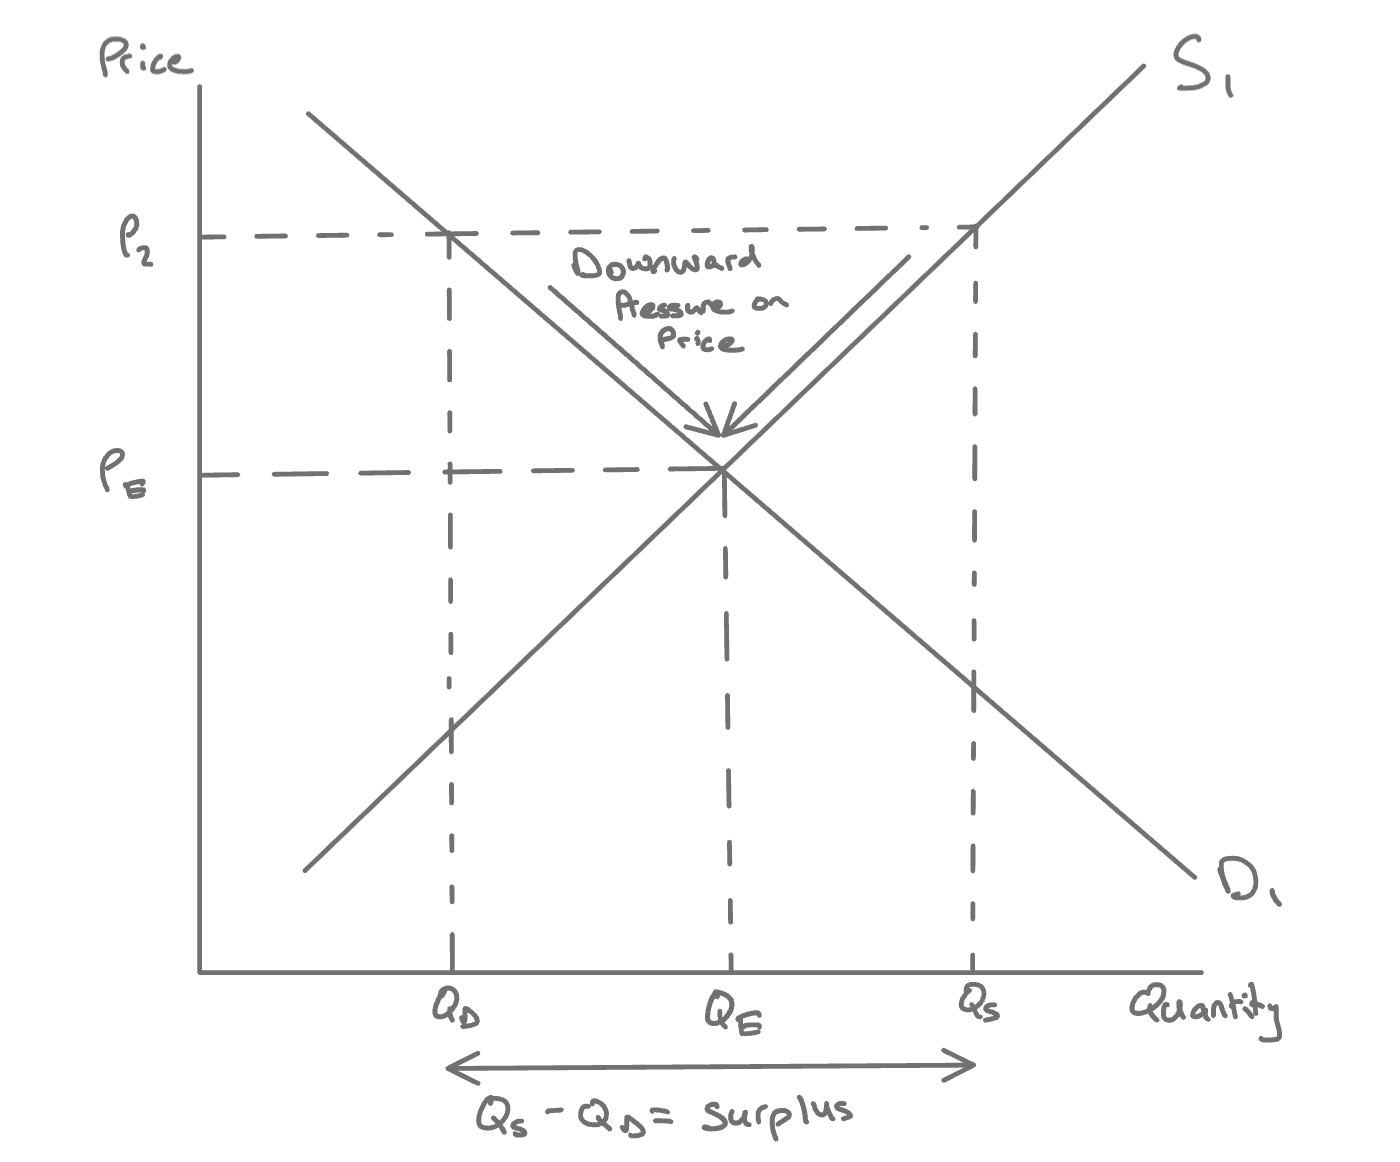
At the above-equilibrium price P2, firms want to sell Qs but consumers demand only Qd, so the gap Qs - Qd is excess supply. As sellers cut price back toward Pe, quantity demanded extends and quantity supplied contracts until the market returns to equilibrium Qe.
The result is a surplus of unsold goods. Firms may have stock building up in warehouses or on shop shelves, and holding that stock is costly. To attract more buyers and clear the surplus, sellers cut price.
As price falls:
- quantity demanded extends
- quantity supplied contracts
Again, the market moves back toward equilibrium. Adam Smith described this kind of decentralised adjustment as the invisible hand: individuals respond to incentives, and the market moves toward a clearing price without a planner directing every decision.
Common mistake
A shortage or surplus does not mean the whole demand or supply curve has shifted. If the good's own price changes, the market moves along the existing curves. Curves shift only when a non-price factor changes.
Shifts and a New Equilibrium
Markets rarely stay unchanged. If demand shifts or supply shifts, the old equilibrium is no longer the market outcome. A new intersection between demand and supply creates a new equilibrium price and quantity.
The most useful exam pattern is:
| Change | Equilibrium price | Equilibrium quantity |
|---|---|---|
| Demand increases | Rises | Rises |
| Demand decreases | Falls | Falls |
| Supply increases | Falls | Rises |
| Supply decreases | Rises | Falls |
Demand shifts move price and quantity in the same direction. Supply shifts move them in opposite directions.
A slightly harder exam version is when demand and supply shift at the same time. Then one part of the answer may be definite while the other depends on which shift is larger.
| Combined shifts | Equilibrium price | Equilibrium quantity |
|---|---|---|
| Demand rises and supply falls | Definitely rises | Ambiguous |
| Demand falls and supply rises | Definitely falls | Ambiguous |
| Demand rises and supply rises | Ambiguous | Definitely rises |
| Demand falls and supply falls | Ambiguous | Definitely falls |
If both curves shift together, do not overclaim. If the two shifts push price or quantity in opposite directions, the final outcome depends on the relative size of the shifts.
[DIAGRAM: asset_name: 1.2.6 - Price determination - diagram 4; asset_slug: 1.2.6 - 4; recommended_method: retained_png; description: Retained source diagram supporting 1.2.6 - Price determination; the packaged PNG preserves the original educational visual.]
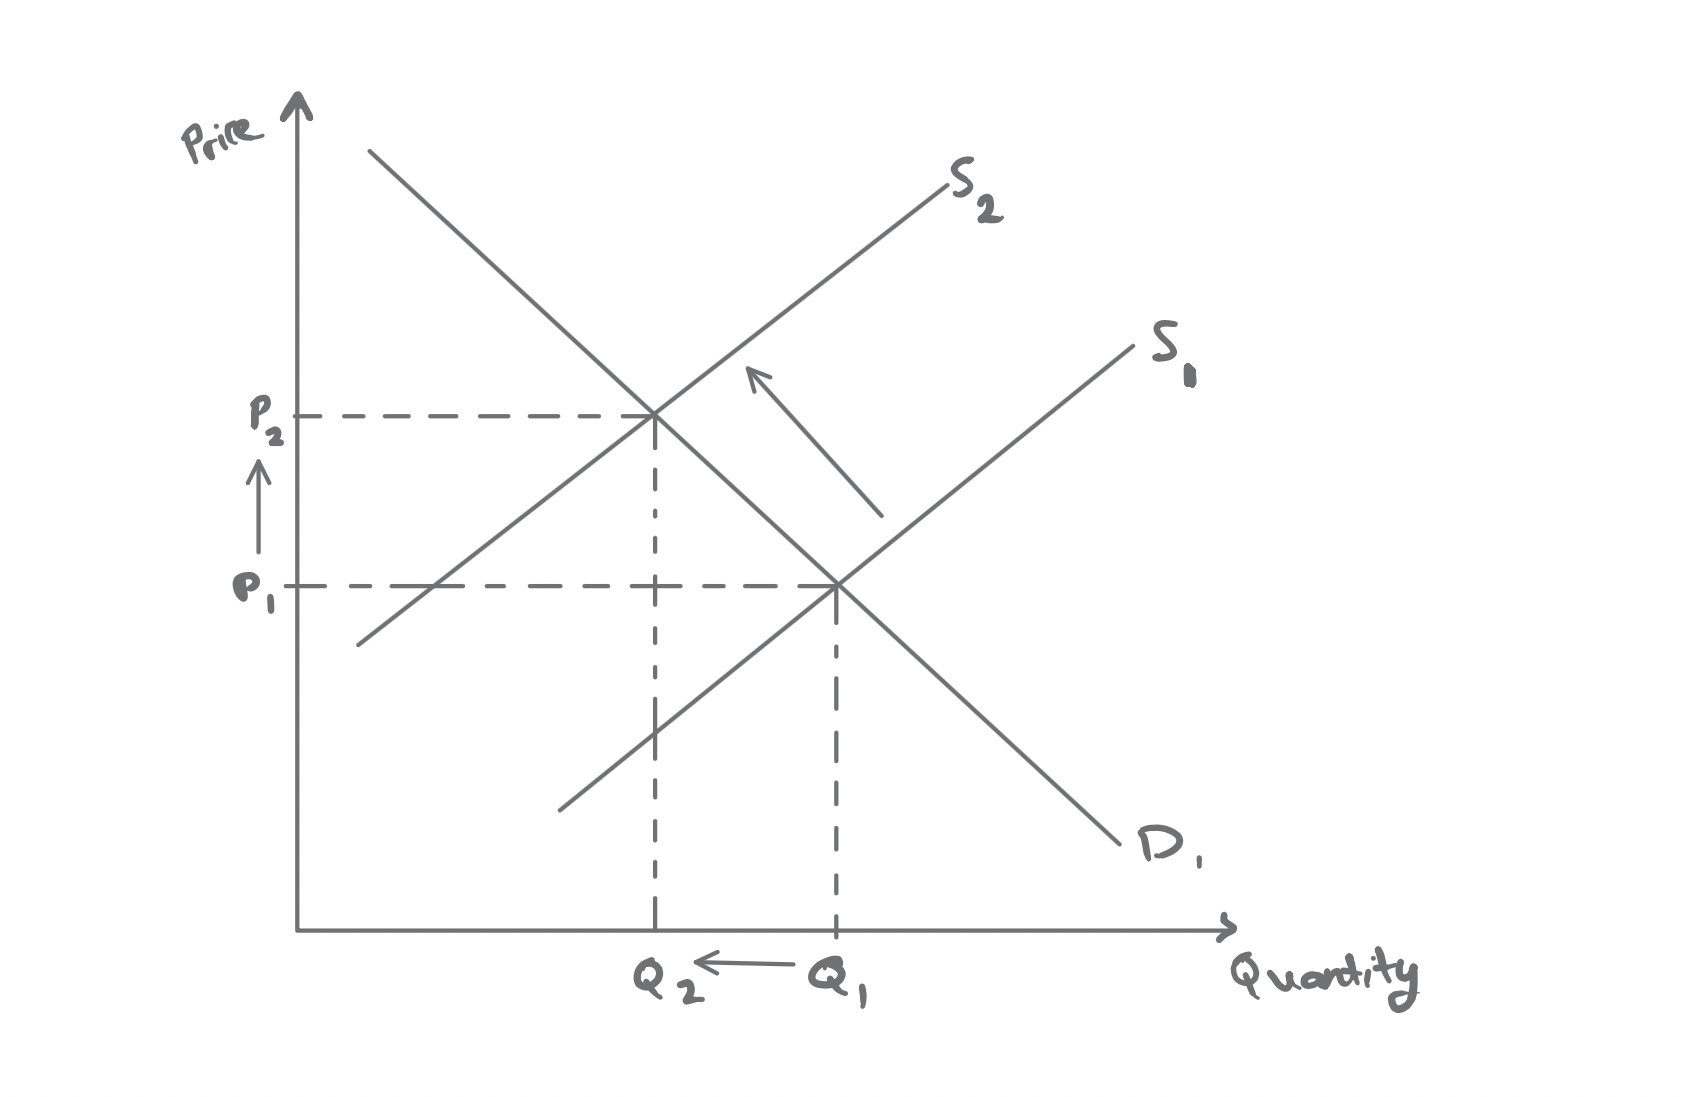
The shift from S1 to S2 moves the market from the original equilibrium at P1, Q1 to the new equilibrium at P2, Q2, so price rises and quantity falls. A quick exam method is to work in steps:
- identify the market
- identify the shock
- decide whether demand or supply shifts
- decide whether the shift is left or right
- trace the effect on equilibrium price and quantity
A compact worked example makes the logic clearer. Suppose disease reduces cattle herds in the UK beef market. This is a fall in supply, so the supply curve shifts left. At the old price there is now excess demand, which pushes price up. The new equilibrium has a higher price and a lower quantity.
You can apply the same logic to demand. In the UK market for holiday flights, demand often rises during school-holiday periods. If airlines cannot expand capacity much in the short run, that rightward shift in demand tends to raise equilibrium prices and increase the quantity sold.
Quick Recap
- Equilibrium is where demand equals supply.
- A price below equilibrium creates excess demand and pushes price up.
- A price above equilibrium creates excess supply and pushes price down.
- When demand or supply shifts, the market moves to a new equilibrium price and quantity.
- In exam questions, identify the curve, direction of shift, and then the new equilibrium.