1.1.4 - Production possibility frontiers
Production possibility frontiers, or PPFs, are one of the most useful models in economics because they bring several core ideas together on one diagram. A PPF helps you explain scarcity, efficiency, opportunity cost, and growth, but the key skill is reading the diagram accurately: a movement along the curve is not the same as a shift of the curve, and a point inside the frontier is not the same as long-run growth.
Reading a PPF
Economists simplify reality by showing an economy producing just two goods or services. That simplification makes the trade-offs easier to see without changing the core logic.
Definition: Production possibility frontier (PPF)
A curve showing the maximum combinations of two goods or services that can be produced in a given period with available resources and technology.
[DIAGRAM: asset_name: 1.1.4 - Production possibility frontiers - diagram 1; asset_slug: 1.1.4 - 1; recommended_method: retained_png; description: Retained source diagram supporting 1.1.4 - Production possibility frontiers; the packaged PNG preserves the original educational visual.]
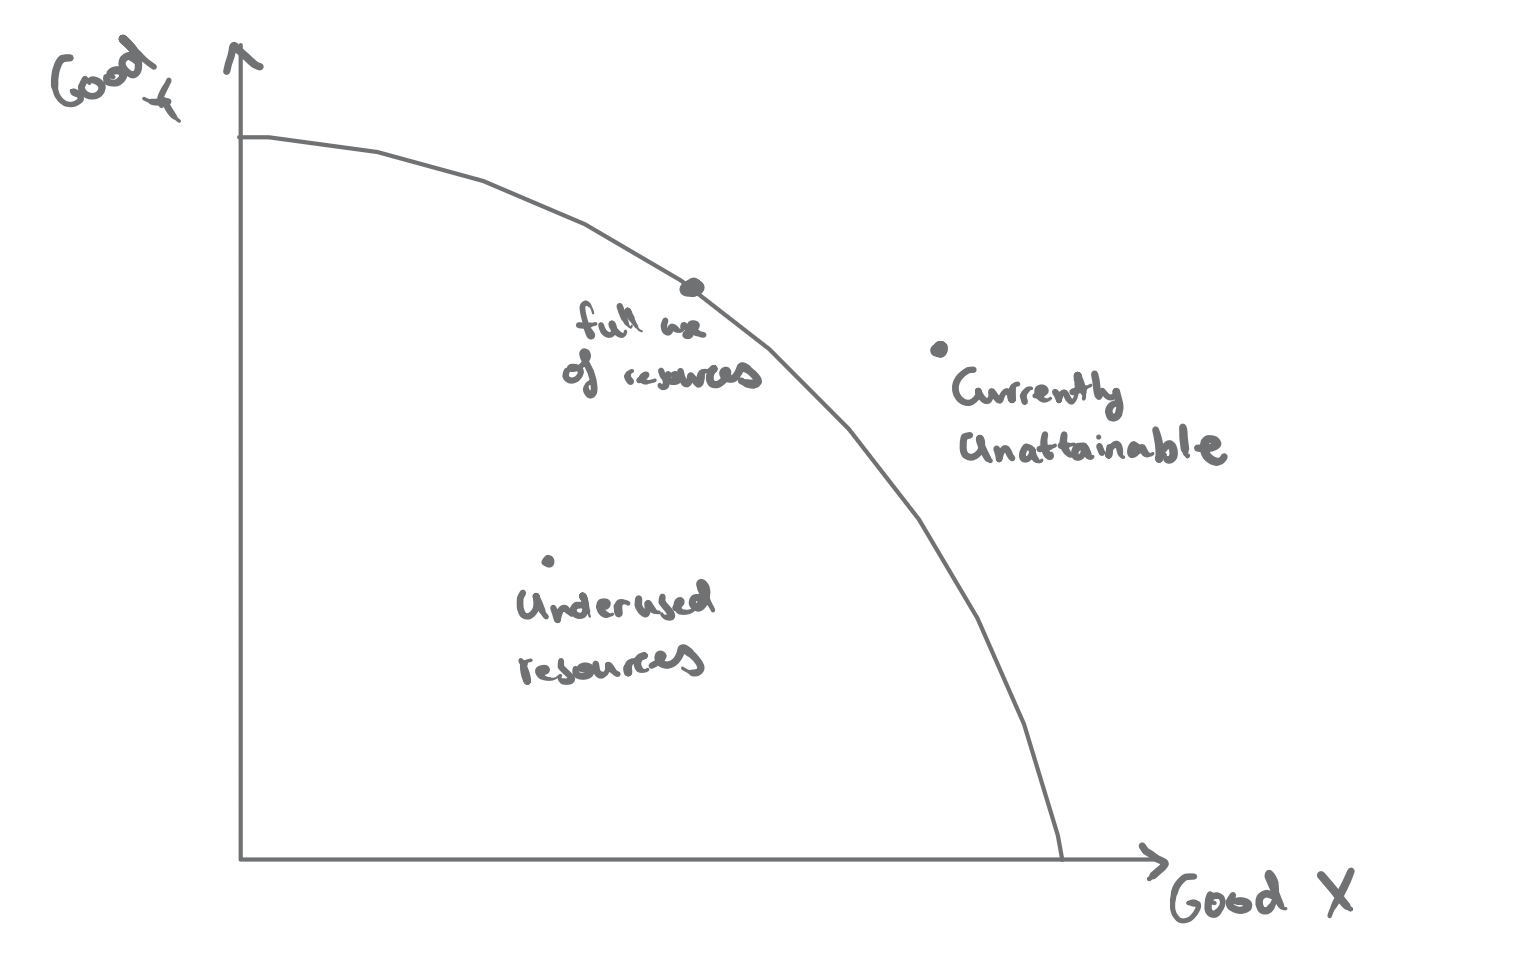
On these Good X and Good Y axes, the point on the frontier shows full use of resources, the point inside shows underused resources or unemployment, and the point outside is currently unattainable with existing resources and technology. A point on the frontier shows the economy's maximum productive potential with its current resources and technology. On Edexcel-style PPF analysis, that means resources are fully employed and the economy is productively efficient: it is getting the maximum output possible from what it currently has.
Common mistake
A point on the PPF shows productive efficiency, but it does not by itself prove allocative efficiency. One point on the frontier may use resources fully while still producing the wrong combination of goods relative to what society most wants.
A point inside the frontier shows productive inefficiency. Some labour, land, capital, or enterprise is unemployed or underused, so the economy could produce more of both goods without needing any new resources. In exam answers, this is the key idea to state clearly: an interior point means spare capacity.
A point outside the frontier is currently unobtainable. With existing resources and technology, the economy cannot reach that combination yet. It is not necessarily impossible forever, but it is beyond current productive capacity.
Opportunity Cost and the Shape of the Curve
When an economy moves from one point on the PPF to another point on the same frontier, it is reallocating resources between the two goods. Because resources are scarce, producing more of one good means sacrificing some of the other.
Definition: Opportunity cost
The value of the next-best alternative forgone when a choice is made.
Suppose a farmer can use land to grow either potatoes or onions. If the farm moves from producing 300 tonnes of onions and 180 tonnes of potatoes to 250 tonnes of onions and 250 tonnes of potatoes, the extra 70 tonnes of potatoes come at the cost of 50 tonnes of onions. That sacrifice is the opportunity cost of producing more potatoes.
Formula: Opportunity cost
Opportunity cost can be shown as:
In the farm example:
If opportunity cost stayed the same throughout, the PPF would be a straight line. That would imply resources were equally suited to producing both goods. In reality, PPFs are usually drawn bowed out from the origin because opportunity cost tends to increase as an economy specialises more.
The reason is that resources are not equally adaptable. Some land, workers, or machines are better suited to one use than another. At first, the economy can switch its more adaptable resources into the production of potatoes with only a small loss of onions. But as it keeps specialising, it has to move increasingly unsuitable resources across. Each extra unit of potatoes then requires a larger sacrifice of onions, so the curve gets steeper and marginal opportunity cost rises.
Movements Along and Shifts of the PPF
This distinction is one of the highest-frequency PPF exam tests. A movement along the PPF means the economy still has the same productive capacity, but it chooses a different combination of output. The economy produces more of one good and less of the other, so the trade-off changes but the frontier itself does not.
A movement along the curve might happen because consumer preferences change, because the government redirects resources, or because a firm changes its product mix. In each case, the economy is reallocating existing resources rather than gaining new capacity.
By contrast, a shift of the whole PPF means productive capacity has changed. An outward shift shows the economy can produce more than before. This may happen because the quantity of resources rises, the quality of resources improves, technology advances, or productivity increases. For example, a larger labour force, more capital, better education and training, or improved machinery can all move the frontier outward.
An inward shift shows a fall in productive capacity. This may happen after natural disasters, war or conflict, emigration that reduces the labour force, environmental degradation such as infertile land, or capital depreciation that is not replaced.
An outward shift represents potential economic growth because the economy is now capable of producing more. That is not the same as actually producing on the new frontier. An economy can still operate inside its PPF even after the curve has shifted outward.
Application
During the 2020 COVID-19 lockdowns, the UK economy operated well below full capacity because many workers and firms were temporarily underused. That is best shown by a point inside the PPF. Output could then recover by moving back towards the frontier even without an outward shift; a true outward shift would require more productive capacity, such as better technology, more capital, or a more skilled workforce.
Capital Goods, Consumer Goods, and Future Growth
One of the most important PPF applications compares capital goods with consumer goods. This is a useful way to show the trade-off between present consumption and future growth.
Definition: Capital goods
Goods used in the production of other goods and services.
When firms buy machinery, factory buildings, tools, or equipment, they are investing in capital goods. This is called investment, and it matters because it can raise future productive capacity.
Definition: Consumer goods
Goods produced for present consumption.
Consumer goods satisfy wants now, such as food, clothing, or entertainment. If an economy chooses to devote more resources to consumer goods today, living standards may be higher now, but future growth may be slower because fewer capital goods are being produced. If it chooses more capital goods today, current consumption has to be sacrificed, but the economy may be able to produce more in the future.
[DIAGRAM: asset_name: 1.1.4 - Production possibility frontiers - diagram 2; asset_slug: 1.1.4 - 2; recommended_method: retained_png; description: Retained source diagram supporting 1.1.4 - Production possibility frontiers; the packaged PNG preserves the original educational visual.]
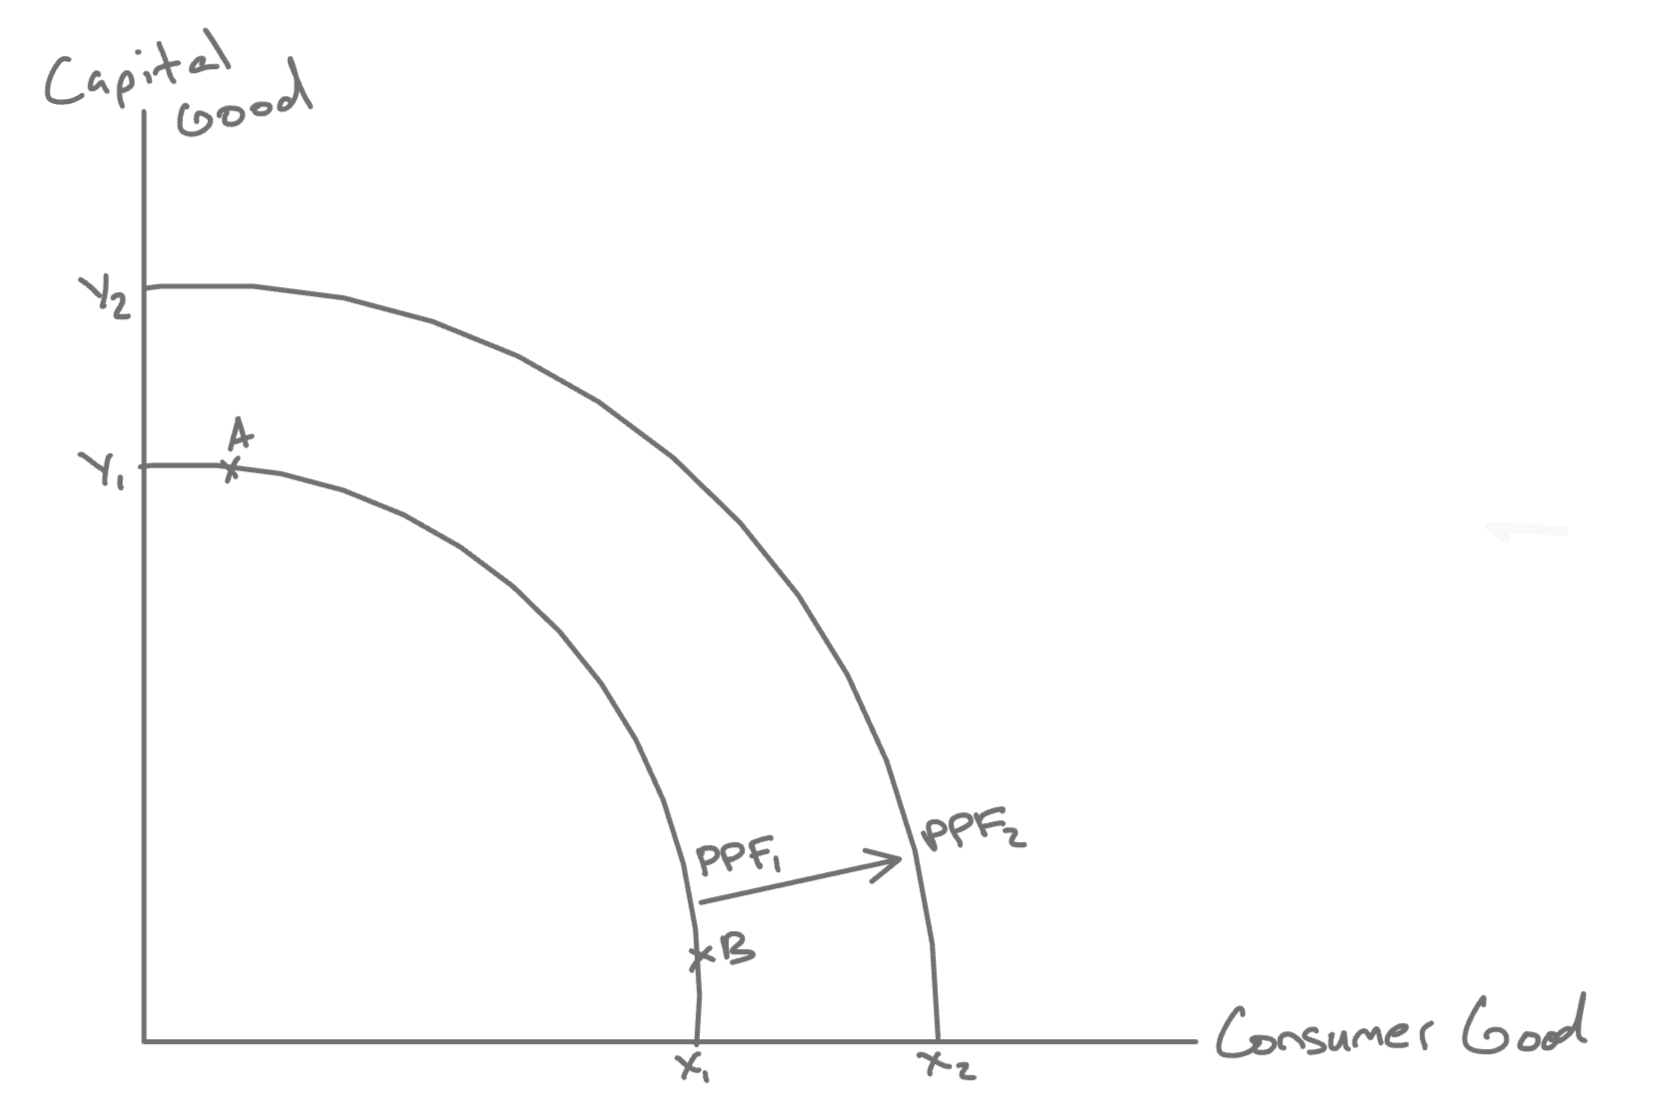
The point with relatively high consumer goods and low capital goods represents higher present consumption, while the point with relatively high capital goods and low consumer goods represents more investment. This is why the PPF captures a genuine trade-off between present and future consumption: if that extra capital-goods production raises productivity or expands capacity, the second outward-shifted PPF shows higher future productive potential.
In the UK, infrastructure projects such as new rail networks, ports, or energy generation are examples of resources being devoted to capital formation rather than immediate consumption. If those projects genuinely improve productivity and capacity, they help the economy produce more in future, even though resources had to be sacrificed in the short run to build them.
Quick Recap
- A PPF shows the maximum output combinations an economy can produce with current resources and technology.
- Points on the frontier show full use of resources, points inside show spare capacity, and points outside are currently unattainable.
- Moving along the PPF shows opportunity cost; shifting the PPF shows a change in productive capacity.
- A bowed-out PPF reflects increasing opportunity cost because resources are specialised.
- Producing more capital goods today may reduce current consumption but can increase future growth.