1.2.3 - Price, income and cross elasticities of demand
Elasticity of demand measures how strongly quantity demanded responds when a key variable changes. In this topic, the key variables are the good's own price, consumer income, and the prices of related goods. These ideas matter because they help firms predict revenue, help governments judge the effects of taxes and subsidies, and help students explain why some markets react sharply while others barely move.
Price Elasticity of Demand
Price elasticity of demand measures the responsiveness of quantity demanded to a change in the good's own price.
Definition: Price elasticity of demand (PED)
The responsiveness of quantity demanded to a change in the good's own price.
The formula is:
PED is usually negative because price and quantity demanded normally move in opposite directions. In exams, we usually interpret the absolute value, so the key issue is how large the response is, not the minus sign itself.
Here is a worked example. A product sells 100 units at £5. The price falls to £3 and quantity demanded rises to 120 units.
- Percentage change in quantity demanded =
20 / 100 x 100 = 20% - Percentage change in price =
-2 / 5 x 100 = -40% PED = 20% / -40% = -0.5
So demand is relatively inelastic because quantity demanded changed by a smaller percentage than price.
| Value | Term | Meaning |
|---|---|---|
| ` | PED | = 0` |
| `0 < | PED | < 1` |
| ` | PED | = 1` |
| ` | PED | > 1` |
| ` | PED | = infinity` |
[DIAGRAM: asset_name: 1.2.3 - Price, income and cross elasticities of demand - diagram 1; asset_slug: 1.2.3 - 1; recommended_method: retained_png; description: Retained source diagram supporting 1.2.3 - Price, income and cross elasticities of demand; the packaged PNG preserves the original educational visual.]
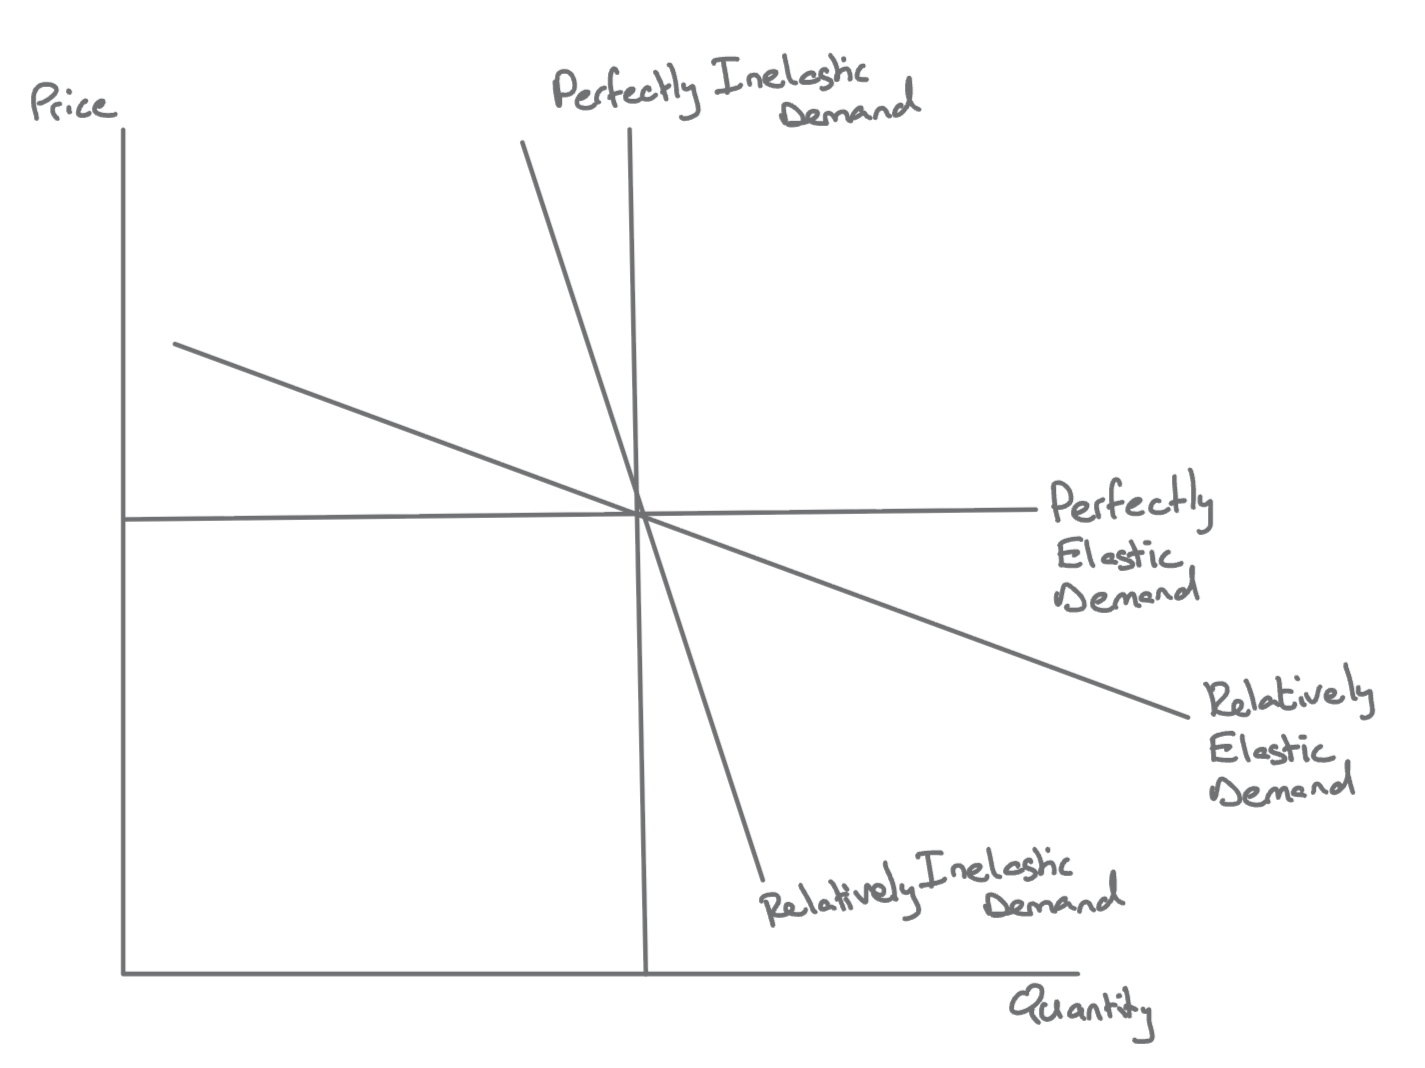
The diagram matters because it links the number to the shape of the curve. The steep curve shows relatively inelastic demand, the shallow curve shows relatively elastic demand, the vertical curve shows perfectly inelastic demand, and the horizontal curve shows perfectly elastic demand. A steeper curve means buyers change quantity by only a little when price changes. A flatter curve means buyers respond much more strongly.
Exam tip
On a straight-line demand curve, PED is not the same at every point. Demand is more elastic at high prices and low quantities, unitary elastic around the midpoint, and more inelastic at low prices and high quantities. This is why the same demand curve can give different PED values depending on where price and quantity start.
What Affects PED
Calculating PED is only the start. Examiners also want you to explain why demand is elastic or inelastic.
The most important influence is the availability of substitutes. If consumers can switch easily to another product, demand is more elastic. If there are few close alternatives, demand is more inelastic. A rise in the price of Coca-Cola in a UK supermarket may push some buyers towards Pepsi or own-brand cola, but a diabetic who needs insulin has far fewer substitutes.
Time also matters. In the short run, consumers may not notice a price change or may be locked into habits and routines. Over time they search for alternatives, change contracts, or alter behaviour, so demand often becomes more elastic.
Whether the good is a necessity or a luxury matters too. Essentials such as electricity tend to have more inelastic demand because households still need them when price rises. More optional spending, such as restaurant meals or holidays, is usually more elastic.
The proportion of income spent on the good is another influence. A large percentage rise in the price of matches or chewing gum is unlikely to change behaviour much because they take up such a small share of income. A similar percentage rise in rent or a train season ticket is much harder to ignore.
Finally, habit or addiction can make demand more inelastic. Smokers may keep buying cigarettes even after price rises, which helps explain why tobacco duties can raise substantial tax revenue.
Application
UK governments have repeatedly increased tobacco duty because demand for cigarettes is fairly inelastic in the short run. Consumption may fall somewhat, but many smokers continue buying, so the tax can still raise large amounts of revenue.
Income Elasticity of Demand
Income elasticity of demand shows how quantity demanded changes when consumer income changes.
Definition: Income elasticity of demand (YED)
The responsiveness of quantity demanded to a change in consumer income.
The formula is:
With YED, the sign is very important because it tells you what type of good you are dealing with.
For example, if household income rises from GBP2,000 a month to GBP2,200, that is a 10% increase. If demand for cinema trips rises from 50 visits to 60 visits, that is a 20% increase. YED = 20% / 10% = 2, so cinema trips would be classed as a luxury good in this example.
| Value | Type of good | What happens when income rises |
|---|---|---|
YED < 0 | inferior good | demand falls |
0 < YED < 1 | normal good that is a necessity | demand rises less than proportionately |
YED > 1 | luxury good | demand rises more than proportionately |
Definition: Inferior goods
Goods with a negative YED, so demand falls as consumer income rises.
An inferior good is one consumers buy less of when their income rises because they switch to something better. Budget instant noodles or some very low-cost supermarket own-brand lines can fit this idea.
A normal good has positive YED. If YED is between 0 and 1, the product is usually a necessity. People buy a little more as income rises, but not dramatically. Basic food and utilities often fit this pattern.
A luxury good has a YED above 1. Demand rises more than proportionately as income rises, so spending grows quickly in a boom and often falls sharply in a downturn. Premium coffee, restaurant meals, and package holidays are good examples.
This is why firms care about YED when real incomes change during the trade cycle. In a recession, sales of luxury goods often weaken, while cheaper inferior products may become more attractive to some households.
Cross Elasticity of Demand
Cross elasticity of demand measures how the quantity demanded of one good responds to a change in the price of another good.
Definition: Cross elasticity of demand (XED)
The responsiveness of quantity demanded of one good to a change in the price of another good.
The formula is:
The sign tells you the relationship between the two goods.
For example, if the price of tea rises by 10% and demand for coffee rises by 5%, then XED = 5% / 10% = +0.5. The positive sign shows the goods are substitutes.
| Value | Relationship | Explanation |
|---|---|---|
XED > 0 | substitutes | a higher price for B increases demand for A |
XED < 0 | complements | a higher price for B reduces demand for A |
XED = 0 | unrelated goods | the price of B has no effect on demand for A |
If two goods are substitutes, consumers can switch between them. If Pepsi becomes more expensive, some consumers may buy Coca-Cola instead, so Coca-Cola's demand rises and XED is positive. The bigger the positive figure, the closer the substitutes usually are.
If two goods are complements, they are used together. If printer prices rise sharply, fewer printers may be bought, which reduces demand for ink cartridges as well. That gives a negative XED.
XED is especially useful for firms watching rivals and related markets. A business needs to know whether a competitor's price cut will steal demand, and whether a rise in the price of a complementary product will damage its own sales.
Revenue and Policy
PED is crucial when firms decide whether changing price will raise or reduce total revenue.
If demand is relatively elastic, quantity demanded changes by a bigger percentage than price. That means a price cut can increase revenue because the gain in sales outweighs the lower price, while a price rise tends to reduce revenue.
If demand is relatively inelastic, quantity demanded changes by a smaller percentage than price. That means a price rise can increase revenue because the loss of sales is relatively small, while a price cut tends to reduce revenue.
If demand is unitary elastic, total revenue stays unchanged because the percentage change in price is exactly matched by the percentage change in quantity demanded.
Here is the same logic in numbers. A firm sells 10,000 units at £5 and PED is -0.5. The firm cuts price to £4.
- Original revenue =
10,000 x £5 = £50,000 - Percentage change in price =
-1 / 5 x 100 = -20% - Because
PED = -0.5, quantity demanded rises by10% - New quantity =
10,000 x 1.10 = 11,000 - New revenue =
11,000 x £4 = £44,000
Revenue falls, which is exactly what we expect when demand is relatively inelastic and price is cut.
[DIAGRAM: asset_name: 1.2.3 - Price, income and cross elasticities of demand - diagram 2; asset_slug: 1.2.3 - 2; recommended_method: retained_png; description: Retained source diagram supporting 1.2.3 - Price, income and cross elasticities of demand; the packaged PNG preserves the original educational visual.]
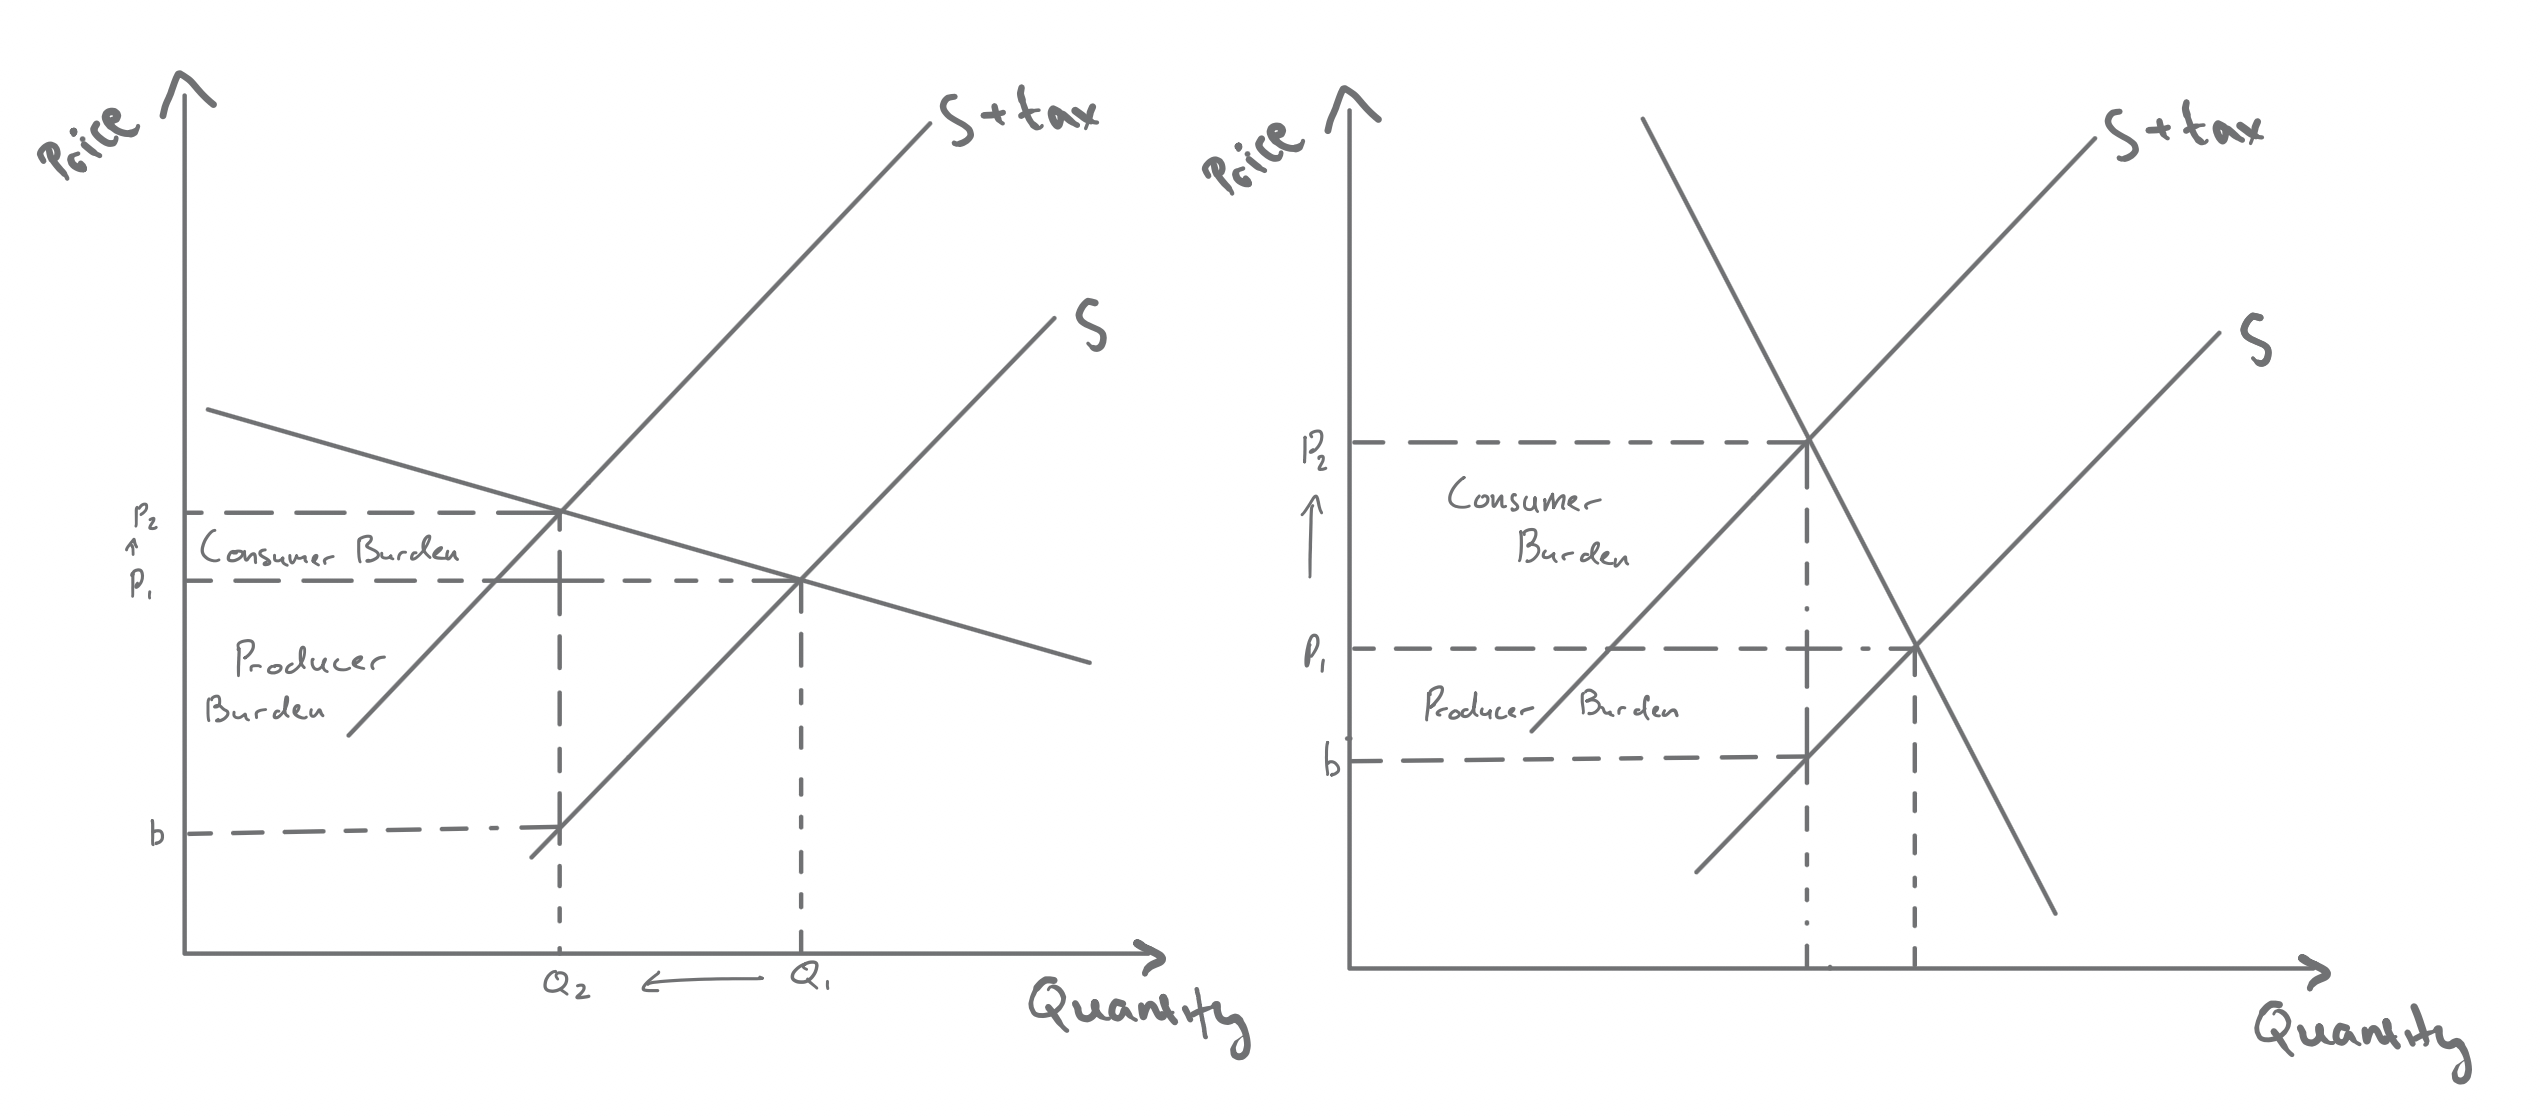
This also explains why PED matters for government policy. When supply shifts from S to S+tax, the panel with the steep inelastic demand curve shows a larger consumer burden and only a small fall in quantity, whereas the panel with the shallow elastic demand curve shows a bigger quantity fall and more burden absorbed by producers. That is why taxes on products such as cigarettes, alcohol, and petrol often raise substantial revenue but may be less effective at cutting consumption sharply.
When demand is relatively elastic, the tax causes a larger fall in quantity and producers may have to absorb more of the burden. Revenue is usually lower, but the policy may be more effective if the aim is to discourage consumption. For subsidies, the broad logic reverses: elastic demand gives a bigger output response, while inelastic demand gives a smaller response.
YED and XED matter here as well. Firms use YED to plan for growth and recession, and they use XED to judge how changes in rivals' prices or complementary markets may affect their own sales.
Exam tip
Do not memorise the revenue rule as a slogan on its own. Always explain it with a chain: price changes, quantity demanded responds according to PED, and total revenue changes because TR = P x Q.
Quick Recap
- PED shows how quantity demanded responds to a change in the good's own price.
- YED shows how demand responds to income and helps classify goods as inferior, normal, or luxury.
- XED shows whether goods are substitutes, complements, or unrelated.
- PED helps explain both business pricing decisions and the likely effects of indirect taxes and subsidies.