1.2.4 - Supply
Supply is the producer side of the market. To use supply analysis properly, you need to know what firms are prepared to sell at different prices, why supply curves usually slope upward, and which changes alter quantity supplied rather than supply itself.
What Supply Means
Supply is the ability and willingness to provide a good or service at a particular price at a given moment in time. Both parts matter. A firm may want to supply more, but if it lacks labour, machinery, stock, or raw materials, it is not able to do so. A firm may also be able to produce, but if the selling price is too low to make production worthwhile, it may not be willing to supply that output.
Definition: Supply
The ability and willingness to provide a good or service at a particular price at a given moment in time.
Supply curves usually slope upward from left to right. The basic reason is that higher prices make production more attractive. If price rises, firms can usually earn more profit on each unit sold, so they have an incentive to increase output.
There is also a cost reason for the upward slope. As firms expand output, they often face rising marginal costs. They may need to pay overtime wages, use less efficient machinery for longer, buy more expensive raw materials, or bring less suitable land and premises into use. Higher prices are needed to make those extra units worth producing.
Movements and Shifts of Supply
This distinction is one of the most important pieces of microeconomic terminology. A movement along the supply curve happens when the price of the good itself changes, with all other influences held constant. A shift of the supply curve happens when a non-price factor changes, so firms now want to supply a different quantity at every possible price.
[DIAGRAM: asset_name: 1.2.4 - Supply - diagram 1; asset_slug: 1.2.4 - 1; recommended_method: retained_png; description: Retained source diagram supporting 1.2.4 - Supply; the packaged PNG preserves the original educational visual.]
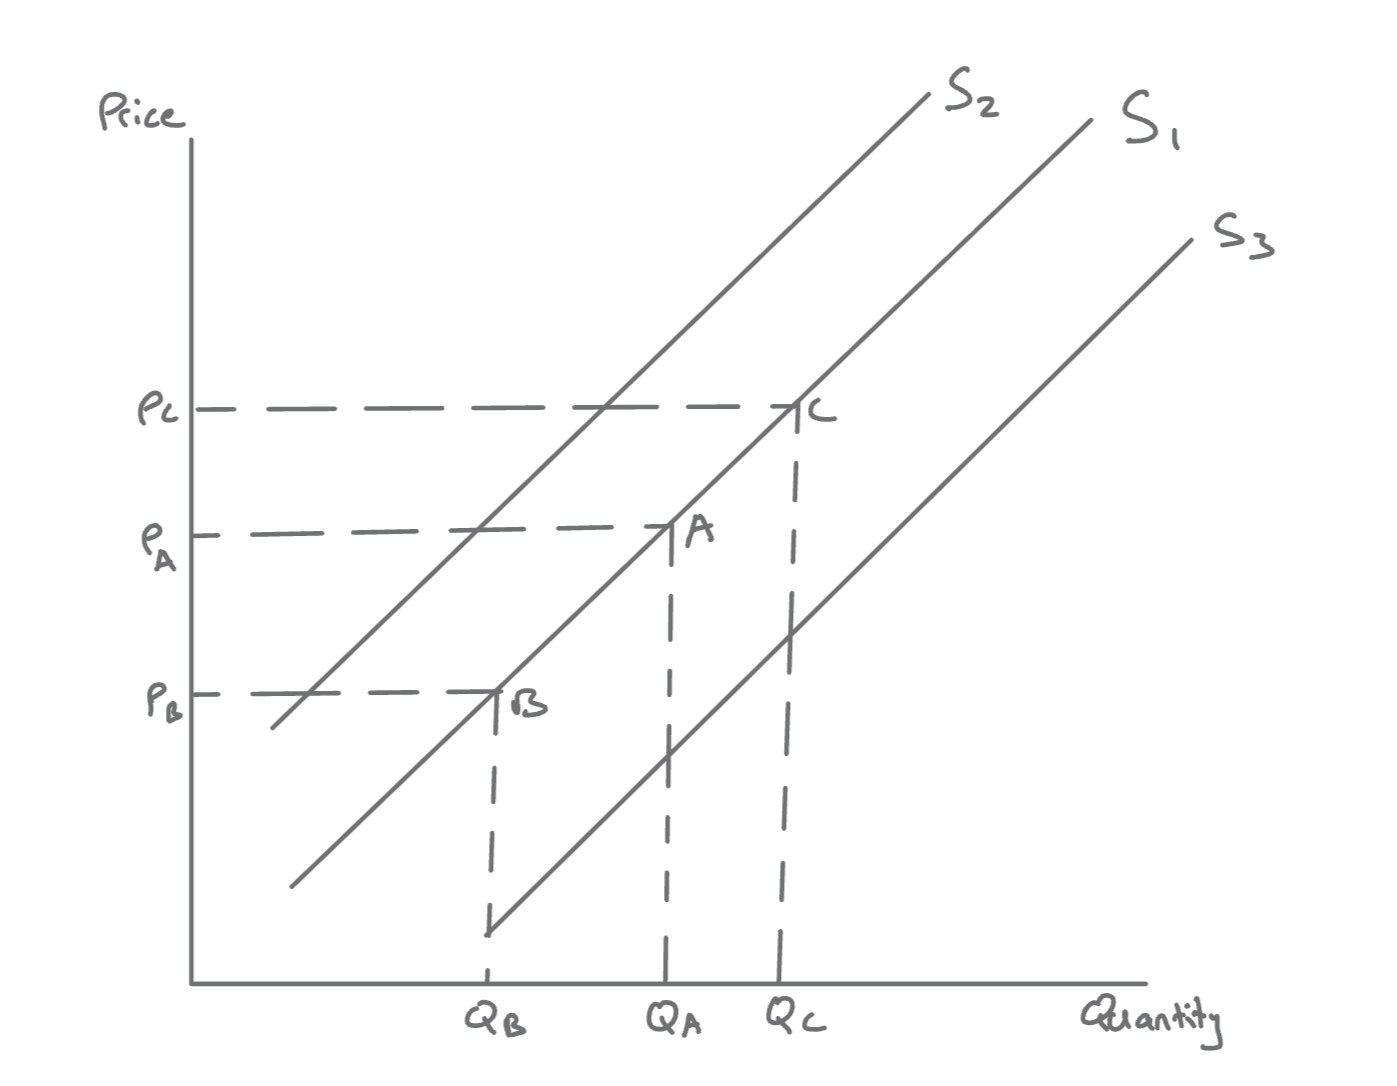
If price falls, firms move from A to B on S1 and quantity supplied falls. This is a contraction in supply. If price rises, firms move from A to C on S1 and quantity supplied rises. This is an extension in supply.
If something other than the good's own price changes, the whole curve moves. At the same price line, a shift from S1 to S3 gives a higher quantity supplied, while a shift from S1 to S2 gives a lower quantity supplied. A rightward shift is an increase in supply because more is supplied at each and every price. A leftward shift is a decrease in supply because less is supplied at each and every price.
Common mistake
Do not call a movement up the supply curve an "increase in supply". If the good's own price changed, it is an extension or contraction, not a shift.
That wording matters in exams because quantity supplied and supply are not interchangeable terms.
Main Conditions of Supply
The conditions of supply are the factors that shift the supply curve. The key idea is always the same: if a change makes production easier or more profitable, supply tends to increase; if it makes production harder or less profitable, supply tends to decrease.
Costs of production are usually the most important condition of supply. If wages, rent, transport, energy, or raw material costs rise while the selling price stays the same, profit margins shrink. Firms then have less incentive to produce, so supply shifts left. If those costs fall, production becomes more profitable and supply shifts right.
Technology usually increases supply because it raises productive efficiency. A firm may be able to produce more output with the same inputs, or the same output with fewer inputs. Either way, unit costs fall and supply shifts right. If productive technology is disrupted or lost, the opposite can happen and supply may shift left.
Weather matters especially in agricultural markets. Good weather can increase crop yields, so more wheat, fruit, or milk can be supplied at every price. Bad weather reduces yields and shifts supply left.
Application
In the UK wheat market, a very wet growing season or harvest period can reduce both the quantity and quality of wheat that reaches the market. The supply curve shifts left because less wheat can be brought to market at each price.
That helps explain why food prices can be volatile: part of supply depends on conditions outside producers' control.
Other Conditions of Supply
Some supply changes depend on how producers use their resources across different goods. In joint supply, producing one good automatically creates another. Beef and leather are a classic example because both come from cattle. If beef prices rise and farmers rear more cattle, the supply of leather also increases.
In competitive supply, the same resources can be used to produce one good or another. A farmer may use land for wheat or barley. If wheat becomes more profitable, some land is switched into wheat production and the supply of barley falls. The barley supply curve shifts left even though the price of barley itself may not have changed.
Taxes and subsidies also affect supply. An indirect tax increases firms' costs, so supply tends to shift left. A subsidy reduces effective costs and usually shifts supply right. Government legislation and regulation can have a similar effect if firms must meet new environmental, health and safety, or licensing requirements. Deregulation can reduce costs and increase supply.
The number of firms in the market affects total market supply. If new firms enter, market supply rises. If firms leave the industry because of bankruptcy or better opportunities elsewhere, market supply falls.
The goals of the supplier can matter too. Most textbook analysis assumes profit maximisation, but some firms, co-operatives, or social enterprises may place more weight on market share, service provision, or community benefit. That can change how willing they are to supply at a given price.
Finally, producer cartels may deliberately restrict output to raise price. OPEC is the classic example. When oil-producing countries agree production cuts, market supply is being held back deliberately rather than changing because the market price of oil moved.
Application
When OPEC restricts oil output, that is a leftward shift in market supply caused by cartel behaviour. It is not a movement along the supply curve, because the cause is a deliberate limit on output rather than a change in the oil price itself.
| Factor | Increase in supply (shift right) | Decrease in supply (shift left) |
|---|---|---|
| Costs of production | Costs fall | Costs rise |
| Technology | Productivity improves | Productivity deteriorates |
| Weather | Favourable conditions | Unfavourable conditions |
| Related goods in production | Joint supply expands | Competitive supply pulls resources away |
| Taxes and subsidies | Subsidy introduced | Indirect tax introduced |
| Regulation | Deregulation or lower compliance costs | More costly regulation |
| Number of firms | Entry | Exit |
| Supplier goals and cartels | Greater willingness to supply | Deliberate restriction of output |
Quick Recap
- Supply means the ability and willingness to provide a good or service at a given price at a given moment in time.
- A change in the good's own price causes a movement along the supply curve: an extension or contraction.
- A non-price factor causes a shift of the whole curve: an increase or decrease in supply.
- Costs, technology, weather, related goods in production, taxes, subsidies, regulation, firm entry or exit, supplier goals, and cartels can all change supply.