1.2.2 - Demand
Demand is central to understanding how markets work because economists care not just about what consumers want, but what they are both willing and able to buy. In this lesson, the key exam skill is to separate changes in a good's own price from the non-price factors that shift demand, and then link that to why the demand curve slopes downward.
What Demand Means
Demand is the ability and willingness to buy a particular good at a given price at a given moment in time. That is more precise than saying consumers simply "want" something.
Definition: Demand
The ability and willingness to buy a particular good at a given price at a given moment in time.
If someone wants the latest phone but cannot afford it, that desire does not count as demand. In economics, demand always includes purchasing power as well as willingness to buy. A demand curve then shows the relationship between price and quantity demanded.
Movements and Shifts of the Demand Curve
This is one of the most common exam distinctions in microeconomics. A change in the price of the good itself causes a movement along the demand curve. A change in any other factor causes the whole demand curve to shift.
[DIAGRAM: asset_name: 1.2.2 - Demand - diagram 1; asset_slug: 1.2.2 - 1; recommended_method: retained_png; description: Retained source diagram supporting 1.2.2 - Demand; the packaged PNG preserves the original educational visual.]
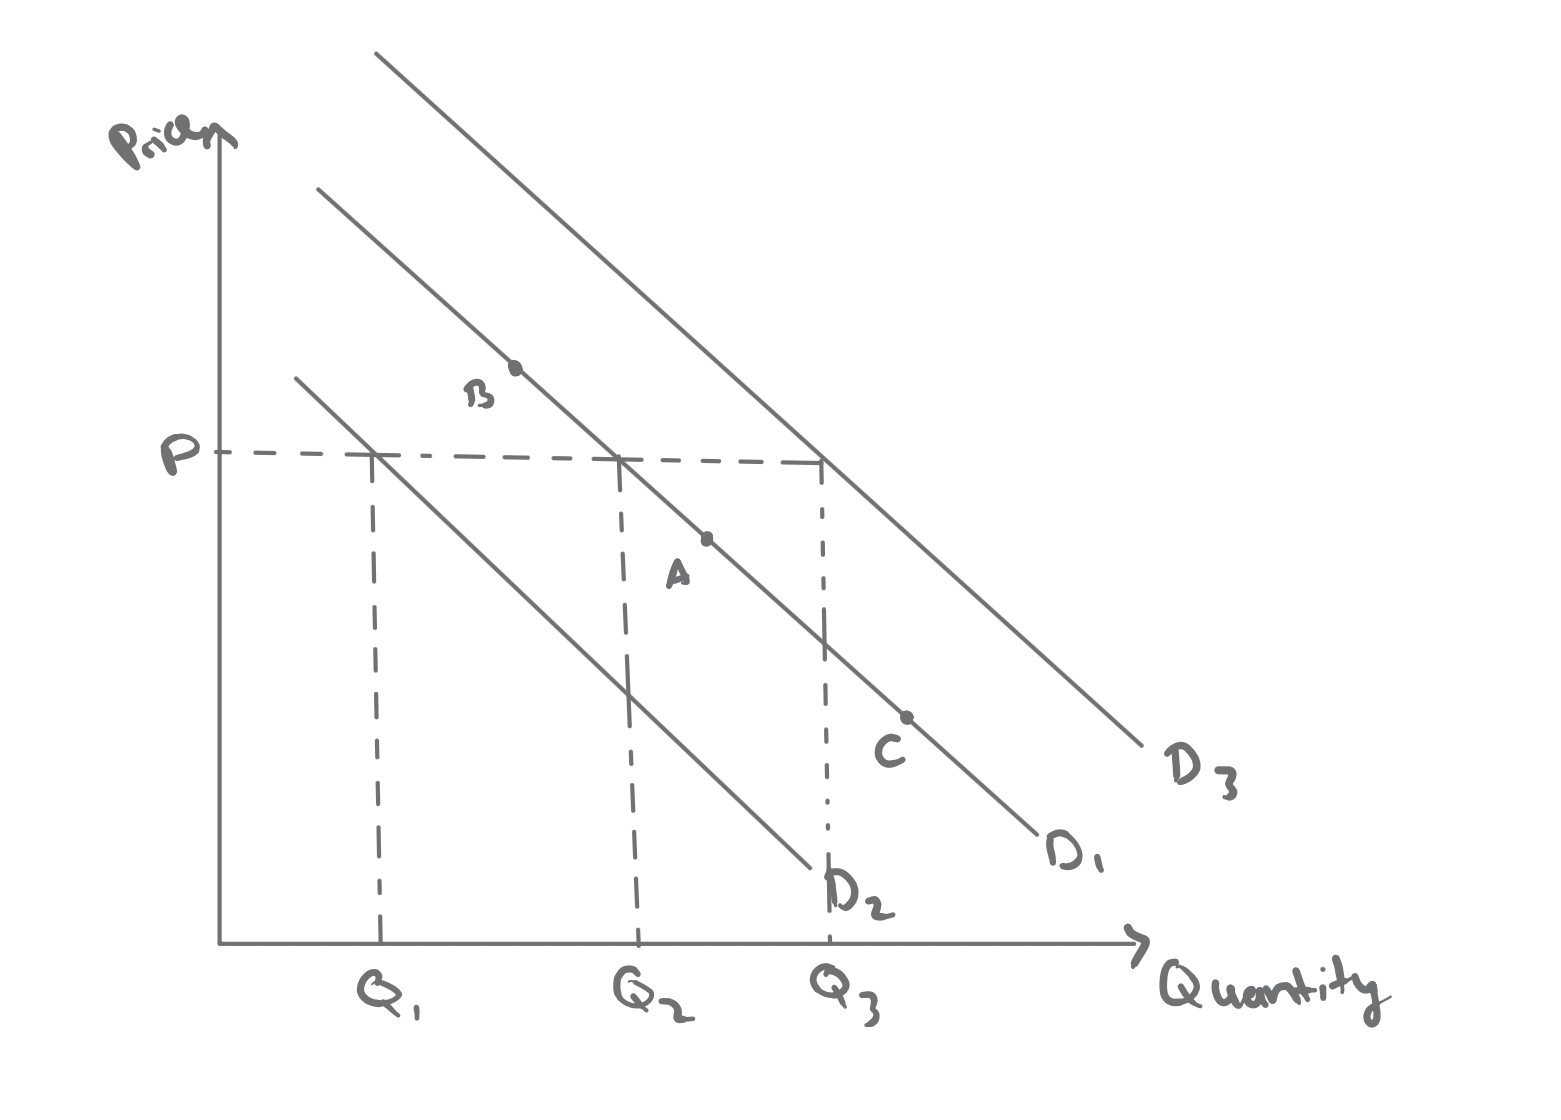
When price rises from A to B, quantity demanded falls and there is a contraction in demand. When price falls from A to C, quantity demanded rises and there is an extension in demand. In both cases, other influences are held constant, or ceteris paribus.
A shift happens when a non-price factor changes. A shift from D1 to D3 is an increase in demand, so more is demanded at every price. At price P, quantity demanded rises from Q1 to Q3. A shift from D1 to D2 is a decrease in demand, so less is demanded at every price. At price P, quantity demanded falls from Q1 to Q2.
Common mistake
Extension and contraction describe movements along the curve caused by the good's own price changing. Increase in demand and decrease in demand describe shifts of the whole curve.
That wording matters because "quantity demanded rises" is not the same as "demand rises". The first is a movement along the curve caused by a price change. The second is a shift caused by a condition of demand.
The Conditions of Demand
The conditions of demand are the non-price factors that shift the demand curve. A useful mnemonic is PIRATES. If one of these changes, consumers may want to buy more or less at every possible price.
Population: If population rises, demand for many products rises because there are more potential consumers. Changes in migration, birth rates, and age structure can all affect demand patterns.
Income: For most goods, which are normal goods, rising income increases demand because consumers can afford more. For inferior goods, rising income can reduce demand as consumers switch to better alternatives. Budget supermarket ranges or some forms of bus travel are common examples.
Related goods: Some goods are linked. Substitutes can be used instead of each other, so if Nike trainers become more expensive, demand for Adidas trainers may rise. Complements are used together, so if DVD players or games consoles become cheaper, demand for DVDs or games may rise as well.
Advertising: Successful advertising can shift demand to the right by changing consumer preferences. Advertising by rivals can have the opposite effect and reduce demand for your product.
Tastes and fashion: If a product becomes fashionable, demand rises. If tastes change against it, demand falls. This is one reason clothing retailers keep refreshing their ranges.
Expectations: If consumers expect prices to rise in future, they may buy now, increasing current demand. If they expect prices to fall, as often happens in technology markets, they may delay purchases. Expectations of shortages can also cause temporary demand spikes.
Seasons: Weather and time of year cause predictable shifts in demand. Summer tends to raise demand for sun cream and ice cream, while winter raises demand for umbrellas and heating oil.
Government legislation: Laws can require purchases, discourage them, or remove legal demand entirely. Safety rules and outright bans both affect demand.
Application
In the UK, compulsory child car seat rules increased demand for approved car seats because many parents were legally required to buy them. In supermarket retail, a strong Tesco advertising campaign can also raise demand for Tesco while reducing demand for rivals such as Asda.
All of these are non-price influences. If one of them changes, the demand curve shifts because consumers want to buy a different quantity at each and every price.
Why the Demand Curve Slopes Down
The main explanation is diminishing marginal utility. Utility means satisfaction. Total utility is the overall satisfaction a consumer gets from all the units consumed, while marginal utility is the extra satisfaction from one more unit.
Think about eating pizza when you are hungry. The first slice gives a lot of satisfaction. The second still gives satisfaction, but usually a bit less. By the fourth or fifth slice, the extra benefit from one more slice is much smaller than it was at the start.
Definition: Diminishing marginal utility
As a consumer consumes more units of a good, the additional satisfaction gained from each extra unit falls, assuming other factors stay constant.
This helps explain the downward-sloping demand curve. If each extra unit brings less satisfaction, consumers are only willing to pay a lower price for additional units. The first unit might be worth GBP10 to a consumer, but the fifth might only be worth GBP2. To persuade the consumer to buy more, price has to fall.
There is a second way to express the same idea. Rational consumers try to allocate limited income so that the marginal utility per pound spent is equal across goods.
Formula: Utility maximisation
A consumer maximises satisfaction when the marginal utility per pound spent is equal across goods:
If the price of good A rises while its marginal utility stays the same, falls. Good A now gives less satisfaction per pound, so the consumer buys less of it and switches spending towards other goods.
So the demand curve slopes downward because later units are valued less, and because a higher price makes the good worse value compared with alternative uses of income. That is why higher prices lead to lower quantity demanded.
Quick Recap
Demand means willingness and ability to buy at a given price and time. A change in the good's own price causes an extension or contraction along the curve, while a non-price change causes an increase or decrease in demand by shifting the whole curve. The conditions of demand can be remembered with PIRATES, and diminishing marginal utility helps explain why demand curves slope downward.