1.2.2g-l - Purification, chromatography, cells, rates and safety
This lesson is about choosing and using practical techniques accurately. You will learn how to handle solid and liquid products differently, how to check purity or separation using melting point and chromatography, how to set up an electrochemical cell for a voltage reading, and how to measure reaction rate by two different practical approaches.
Method Choice and Risk
In this part of Module 1, the chemistry is mostly practical decision-making. A good answer starts by identifying what you are trying to do: purify a solid, purify a liquid, compare components on a chromatogram, measure a voltage, or measure a rate. The method then follows from the physical state of the product and the measurements needed.
Risk Management
Risk management means identifying hazards, estimating the risk during the actual method, and choosing controls that reduce harm while still allowing the experiment to work.
The four hazard categories in this row are corrosive, irritant, flammable and toxic. A hazard tells you the kind of harm a substance can cause. Risk depends on how the substance is used: concentration, volume, heating, vapour production, exposure time and the chance of contact.
For example, ethanol is flammable. The practical risk is greater if it is heated near a naked flame, so a water bath or electric heater is normally safer than a Bunsen burner. A concentrated acid may be corrosive, so the method should use eye protection, small quantities, controlled transfer with suitable apparatus and immediate spill-washing procedures. A toxic volatile liquid should be handled to reduce inhalation, often with good ventilation or a fume cupboard when instructed.
The strongest practical answers link the named hazard to the step where harm could occur and then give a control that reduces that specific risk.
Worked reasoning: choosing a safe method
A student needs to separate an organic liquid from an aqueous layer. The organic liquid is flammable and has harmful vapours. The key risk is not just "it is dangerous"; it is vapour exposure and ignition during transfer and purification. A good method would use a separating funnel with the stopper handled carefully, vent the funnel away from people if gas pressure may build up, keep the liquid away from naked flames, dry the organic layer with an anhydrous salt, then distil using appropriate heating rather than an open flame if flammable vapours are likely.
Solid Products
The required method for purifying a solid product is recrystallisation. The idea is that the desired solid is much more soluble in hot solvent than in cold solvent, while many impurities either stay dissolved in the cold solvent or are removed during hot filtration.
[DIAGRAM: asset_name: Lesson 1.2.2g-l: Purification, Chromatography, Electrochemical Cells, Rates and Safe Handling - diagram 01; asset_slug: 01_02_02c_purification_chromatography_cells_rates_and_safe_handling__diagram_01; recommended_method: drawn_chem; description: Two-route practical decision flow comparing solid purification by recrystallisation and liquid purification by separating funnel, drying and distillation.]
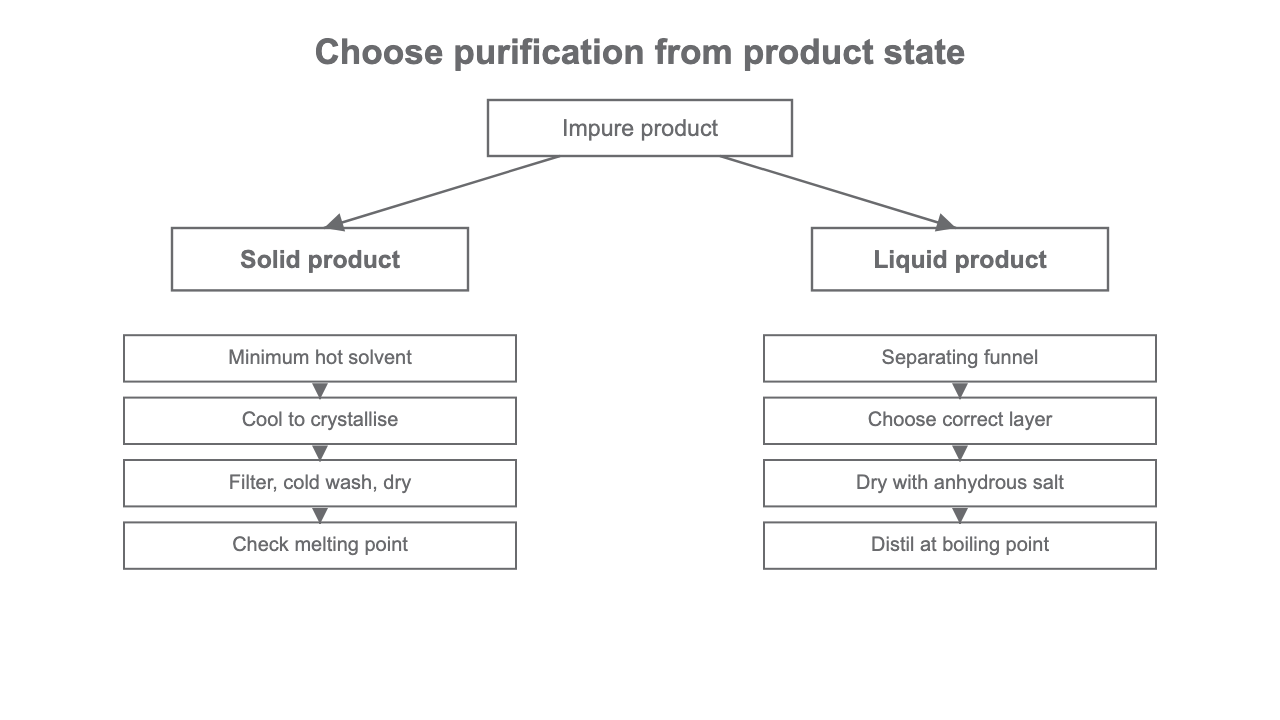
The core recrystallisation sequence is:
- Dissolve the impure solid in the minimum volume of hot solvent.
- If insoluble impurities are present, filter the hot solution.
- Allow the solution to cool so crystals of the product form.
- Filter the crystals, often under reduced pressure.
- Wash the crystals with a small amount of cold solvent.
- Dry the crystals.
Each step has a purpose. A minimum volume of hot solvent reduces product loss because less product remains dissolved when the mixture cools. Cooling slowly encourages better crystals. Washing with cold solvent removes soluble impurities without dissolving much of the product. Drying removes solvent and gives a more reliable mass and melting point.
Melting Point Apparatus
Melting point apparatus heats a small dry sample in a capillary tube and records the temperature range over which the solid melts.
A pure solid usually has a sharp melting point close to its accepted value. An impure solid usually melts over a broader range and at a lower temperature. Melting point evidence can therefore show whether recrystallisation has improved purity.
Worked example: interpreting a melting range
A sample of a solid has a literature melting point of 135 °C. Before recrystallisation it melts from 126-131 °C. After recrystallisation it melts from 133-135 °C. The second sample is purer because its melting range is narrower and closer to the literature value. The answer should mention both ideas: range and closeness to the accepted value.
Liquid Products
A liquid product is not purified by recrystallisation. The required technique here includes using a separating funnel. This is a frequent exam trap: crystals belong to solid purification; layers in a funnel belong to liquid purification.
When a reaction mixture forms two immiscible layers, a separating funnel allows the lower layer to be run off through the tap. You must identify which layer contains the organic product. Sometimes the organic layer is the top layer; sometimes it is the bottom layer. Use density information if it is provided. If unsure in a practical, adding a little water shows which layer is aqueous because that layer increases in volume.
After separation, the organic liquid may still contain water. A drying agent, such as anhydrous magnesium sulfate or anhydrous calcium chloride, removes water from the organic layer. The drying agent is then removed, and the liquid can be purified further by distillation, collecting the fraction at the product's boiling point.
Worked example: choosing the liquid layer
A product has density 1.17 g cm^-3 and water has density about 1.00 g cm^-3. In a separating funnel with an aqueous layer, the product is denser than water, so it is the lower layer. The purification route is: run off the lower organic layer, dry it with an anhydrous salt, remove the drying agent, then distil and collect the liquid at the product's boiling point.
Liquid Products Summary
Solid product: recrystallise, filter, wash cold, dry, then check melting point. Liquid product: separate layers, dry the organic layer, then distil at the boiling point.
Chromatography
This row requires use of thin layer or paper chromatography. Both methods separate components because substances distribute differently between a stationary phase and a mobile phase.
In paper chromatography, the stationary phase is the paper and water held in it; in TLC, the stationary phase is usually a thin solid layer such as silica on a plate. The mobile phase is the solvent that moves up the paper or plate. A component travels further if it is more strongly attracted to the mobile phase than to the stationary phase.
[DIAGRAM: asset_name: Lesson 1.2.2g-l: Purification, Chromatography, Electrochemical Cells, Rates and Safe Handling - diagram 02; asset_slug: 01_02_02c_purification_chromatography_cells_rates_and_safe_handling__diagram_02; recommended_method: drawn_chem; description: TLC plate with pencil baseline above solvent level, separated spots, solvent front, measured distances and Rf formula.]
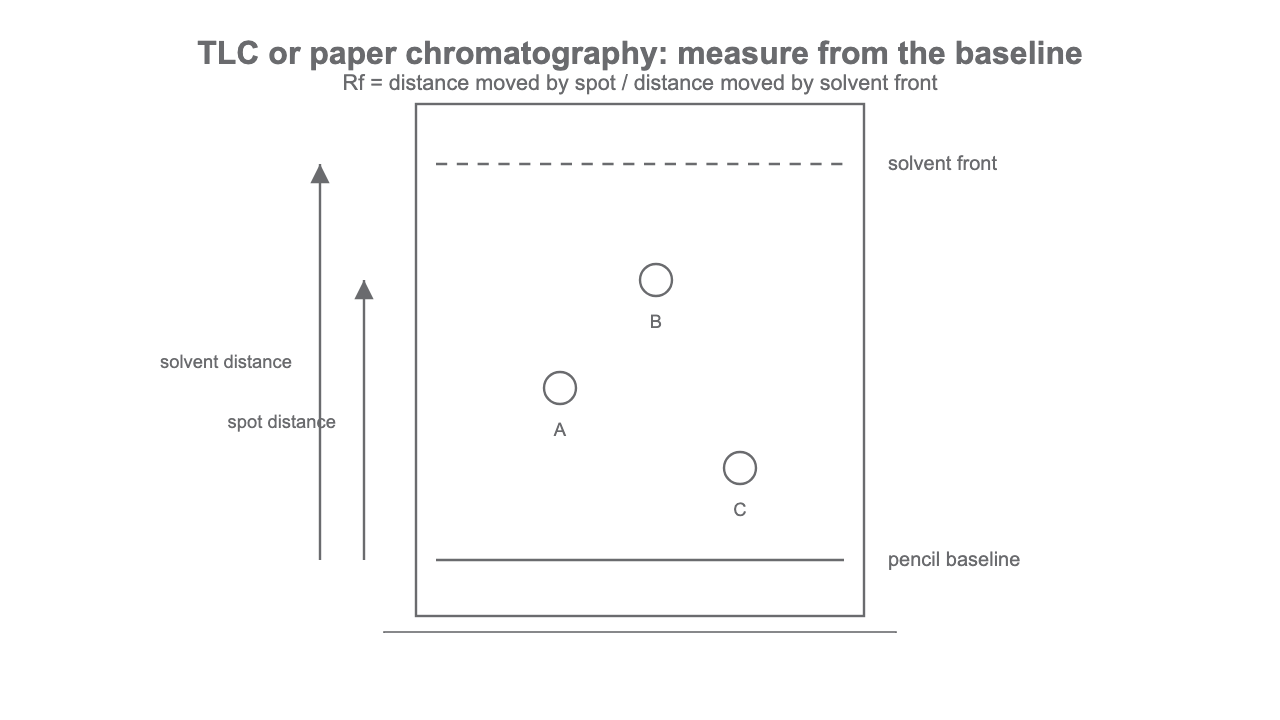
The baseline must be drawn in pencil because ink may dissolve in the solvent and move. The initial spots must start above the solvent level so the samples do not dissolve directly into the solvent reservoir. The solvent front is marked before it evaporates.
Rf Value
Rf has no units because it is a ratio of two distances measured in the same unit. It should be between 0 and 1 if measured correctly from the baseline.
Worked example: calculating Rf
The baseline is 1.0 cm from the bottom of the plate. The solvent front is 7.0 cm from the baseline, and one spot is 4.2 cm from the baseline. The Rf value is:
Do not use the distance from the bottom of the plate. Use distances from the baseline.
Electrochemical Cells
Here you need to set up electrochemical cells and measure voltages. In this lesson, focus on the apparatus and measurement. Detailed electrode-potential calculations and predictions are later Module 5 content.
An electrochemical cell has two half-cells connected by an external circuit and an ion pathway. The external circuit contains a voltmeter or multimeter. The ion pathway is usually a salt bridge, often filter paper soaked in an inert electrolyte such as potassium nitrate. The salt bridge completes the circuit by allowing ions to move and reduce charge build-up.
[DIAGRAM: asset_name: Lesson 1.2.2g-l: Purification, Chromatography, Electrochemical Cells, Rates and Safe Handling - diagram 03; asset_slug: 01_02_02c_purification_chromatography_cells_rates_and_safe_handling__diagram_03; recommended_method: drawn_chem; description: Labelled electrochemical cell with two beakers, metal or platinum electrodes, salt bridge dipping into both solutions, voltmeter and leads.]
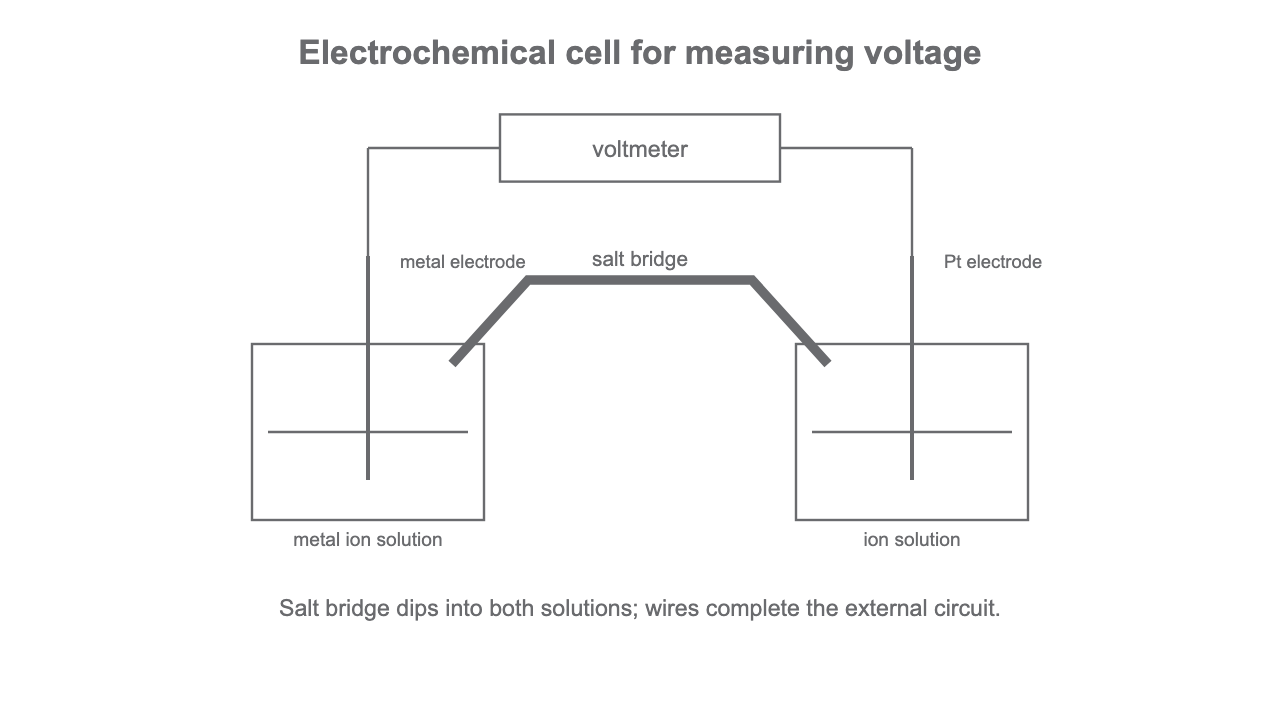
For a metal/metal ion half-cell, a strip of the metal dips into a solution containing its ions. For an ion/ion half-cell with no solid metal, an inert platinum electrode is used so electrons can pass between the solution and the external circuit without platinum reacting.
To obtain a useful voltage reading:
- Use clean electrodes and fresh solutions.
- Make sure the salt bridge dips into both solutions.
- Connect both electrodes to the voltmeter.
- Record the voltage and the sign or orientation of the leads.
- Keep conditions controlled if comparison is intended.
For comparisons, keep solution concentration, temperature and electrode surface condition consistent. Let the reading settle before recording it, clean or rinse electrodes where appropriate, and repeat the measurement if the voltage drifts or contact is poor.
Worked example: spotting an incomplete cell
A student sets up two beakers, each with a metal strip in solution, and connects both strips to a voltmeter. The voltmeter reads 0.00 V. If there is no salt bridge, the circuit is incomplete for ionic charge movement, so charge build-up stops electron flow. The improvement is to add a salt bridge dipping into both solutions.
Rate Measurement
This topic requires measurement of rates of reaction by at least two different methods. The specification gives two examples: an initial rate method such as a clock reaction, and a continuous monitoring method.
Rate is about how quickly a reactant is used up or a product is formed. In practical work, you do not always measure concentration directly. Instead, you often measure something that changes as the reaction proceeds, such as time to an endpoint, gas volume, mass loss, colour intensity, pH or conductivity.
[DIAGRAM: asset_name: Lesson 1.2.2g-l: Purification, Chromatography, Electrochemical Cells, Rates and Safe Handling - diagram 04; asset_slug: 01_02_02c_purification_chromatography_cells_rates_and_safe_handling__diagram_04; recommended_method: drawn_chem; description: Side-by-side comparison of an initial-rate clock method with time to visible endpoint and a continuous-monitoring method with gas volume or absorbance plotted against time.]
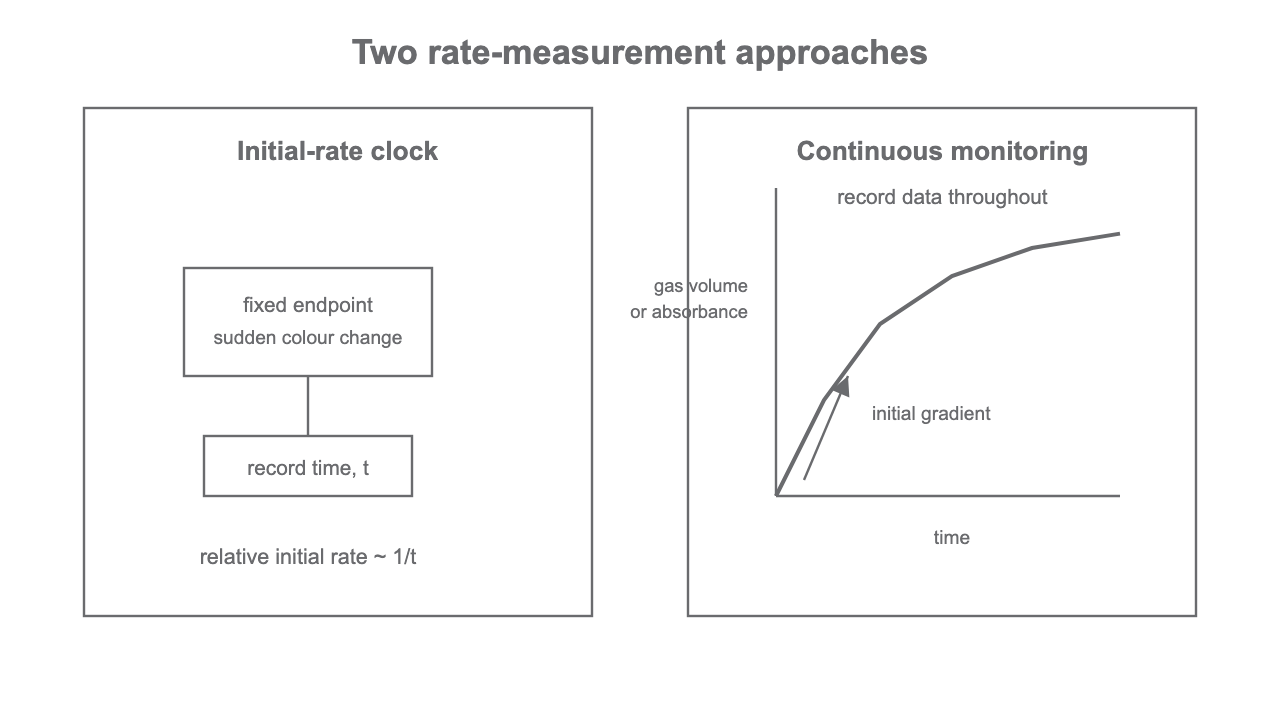
In an initial-rate clock method, you measure the time taken for a fixed, visible change. A common pattern is a sudden colour change after a known small amount of product has formed. If the same endpoint is used each time, a shorter time means a faster initial rate. A simple comparison can use:
This is not a full rate equation. It is a practical way to compare experiments when the endpoint amount is constant.
In continuous monitoring, you record a changing variable throughout the reaction. Examples include collecting gas in a gas syringe and recording volume at regular times, measuring mass loss as gas leaves, or using a colorimeter to monitor absorbance as colour changes. Continuous monitoring can show how rate changes during the reaction because the graph becomes less steep as reactants are used up.
Rate comparisons are only useful if the method is consistent. Keep total volume, concentrations other than the intended variable, temperature, mixing, endpoint judgement and timing method the same. Repeat timings or continuous runs where possible, and identify anomalous values before using a mean or gradient.
Worked example: choosing a method
Magnesium reacting with dilute acid produces hydrogen gas. A continuous monitoring method is suitable: connect the flask to a gas syringe and record gas volume every 10 s. The rate can be compared from the gradient of a volume-time graph or from the initial slope. A clock method would be less natural here because there is no sudden colour-change endpoint.
Worked example: comparing clock rates
Two clock reactions use the same endpoint. Experiment A takes 25 s; Experiment B takes 50 s. Since relative initial rate is proportional to 1/t, A has twice the relative initial rate of B.