03 Section B Option 2, Key question 2 - Intersecting UK achievement patterns (part 1)
Educational achievement varies between social groups, but a national average can hide important differences within them. This part of Key question 2 examines class, ethnicity and gender together, using dated evidence from England and Scotland with their different measures. You will learn to describe a pattern precisely, investigate intersections and distinguish an observed gap from an explanation of it.
Measuring educational achievement
An educational inequality can look different depending on which outcome is measured.
Attainment means the qualifications, grades or scores achieved at a particular stage. England's Attainment 8 score summarises performance in up to eight approved qualifications at the end of Key Stage 4, normally around age 16. English and mathematics can receive double weighting, so it is not simply the mean of eight GCSE grades. Under the current scale its maximum is 90 points. A group average describes the group, rather than the score of every member.
Progress concerns change from an earlier starting point. England's Progress 8 compares attainment at the end of secondary school with that of pupils who had similar Key Stage 2 attainment. Two groups can have different final grades while making similar progress from different starting points. Conversely, pupils with the same final grade may have made different progress. Progress measures provide an adjusted comparison; they do not isolate a school's causal effect from every other influence.
Participation concerns whether people enter or remain in an educational route, such as further or higher education. Subject choice concerns which subjects or pathways they take. A pupil may remain in education but take a different subject combination from another pupil. A high university entry rate therefore does not establish high GCSE attainment, and equal overall grades do not establish equal access to particular subjects.
For example, in an original teaching scenario, two schools have the same average GCSE score but different proportions entering physics at A level. This is evidence about subject participation, not evidence that one school's pupils obtained higher GCSE grades. We need the relevant denominator: all pupils, eligible pupils or those actually taking the examination can produce different percentages.
The DfE does not publish Progress 8 for 2024/25 or 2025/26 because the relevant cohorts missed Key Stage 2 tests during pandemic disruption. An attainment gap for those years must not be relabelled a Progress 8 gap. Source: DfE, Key stage 4 performance, 2024/25.
Class patterns and proxies
Social class is related to educational attainment, but the indicator used to measure disadvantage matters.
Social class concerns a person's position in social and economic relationships, including occupation, employment security and access to resources. Researchers may measure parental occupation, income and education separately or combine them into socio-economic status (SES). These measures overlap without being interchangeable: a highly qualified parent can have a low current income.
Proxy measure
A proxy is an indicator used to stand for a concept that is harder to measure directly. Eligibility for free school meals can indicate economic disadvantage, but it does not measure every aspect of social class.
In England's revised 2024/25 statistics for pupils at the end of Key Stage 4 in state-funded schools, the average Attainment 8 gap between disadvantaged and other pupils was 15.5 points, compared with 13.6 points in 2018/19. The DfE disadvantage category includes pupils eligible for free school meals during the previous six years and specified care-related groups. It is broader than the current FSM eligibility category used in the chart later in this lesson. Source: DfE, 2024/25 release.
That comparison shows a larger measured gap; it does not show that every working-class pupil has low attainment. Nor does “not known to be FSM eligible” mean affluent. Some families have limited resources without meeting the eligibility criteria or appearing in the eligible category. Changes to eligibility and protections can also change who belongs to a group, complicating comparisons over time.
Evidence from another UK system supports a relationship between deprivation and attainment while using a different measure. For 2024/25 school leavers from publicly funded schools in Scotland, the gap between the least and most deprived fifths of areas in achieving five or more passes at SCQF Level 5 or better, under the All SCQF measure, was 33.6 percentage points. This Scottish Government measure covers a wider range of qualifications and concerns leavers at different leaving stages. The Scottish Index of Multiple Deprivation (SIMD) ranks areas, not each family's class position. Source: Scottish Government, published 24 February 2026.
The Scotland and England figures cannot be subtracted to rank which system has the greater “class gap”: they have different populations, qualifications, disadvantage indicators and units. Evidence from one nation is not a UK-wide estimate. Wales and Northern Ireland also have their own education statistics. A precise comparison first asks whether the measures are sufficiently alike.
Disaggregating ethnic patterns
Broad ethnic categories conceal differences between the groups combined within them.
Ethnicity concerns socially recognised identities associated with features such as ancestry, culture and shared history. It is not a biological scale of educational ability. Administrative categories organise a dataset; they cannot capture all the experiences or identities of the pupils within a category.
The DfE's 2024/25 England state-funded end-of-Key-Stage-4 cohort, combining sexes and FSM statuses, had average Attainment 8 scores of 66.1 for Chinese pupils, 58.8 for Indian pupils and 46.5 for Pakistani pupils. Within the broad Black category, African pupils averaged 47.9 and Caribbean pupils 39.2. These official category labels describe different recorded subgroups; “ethnic minority pupils” is too broad to summarise them as one common attainment pattern. Source: DfE ethnic-minor table.
The chart separates selected ethnic categories again, this time by FSM eligibility. The longer White category label is reproduced to avoid confusing it with the broader All White category used later.
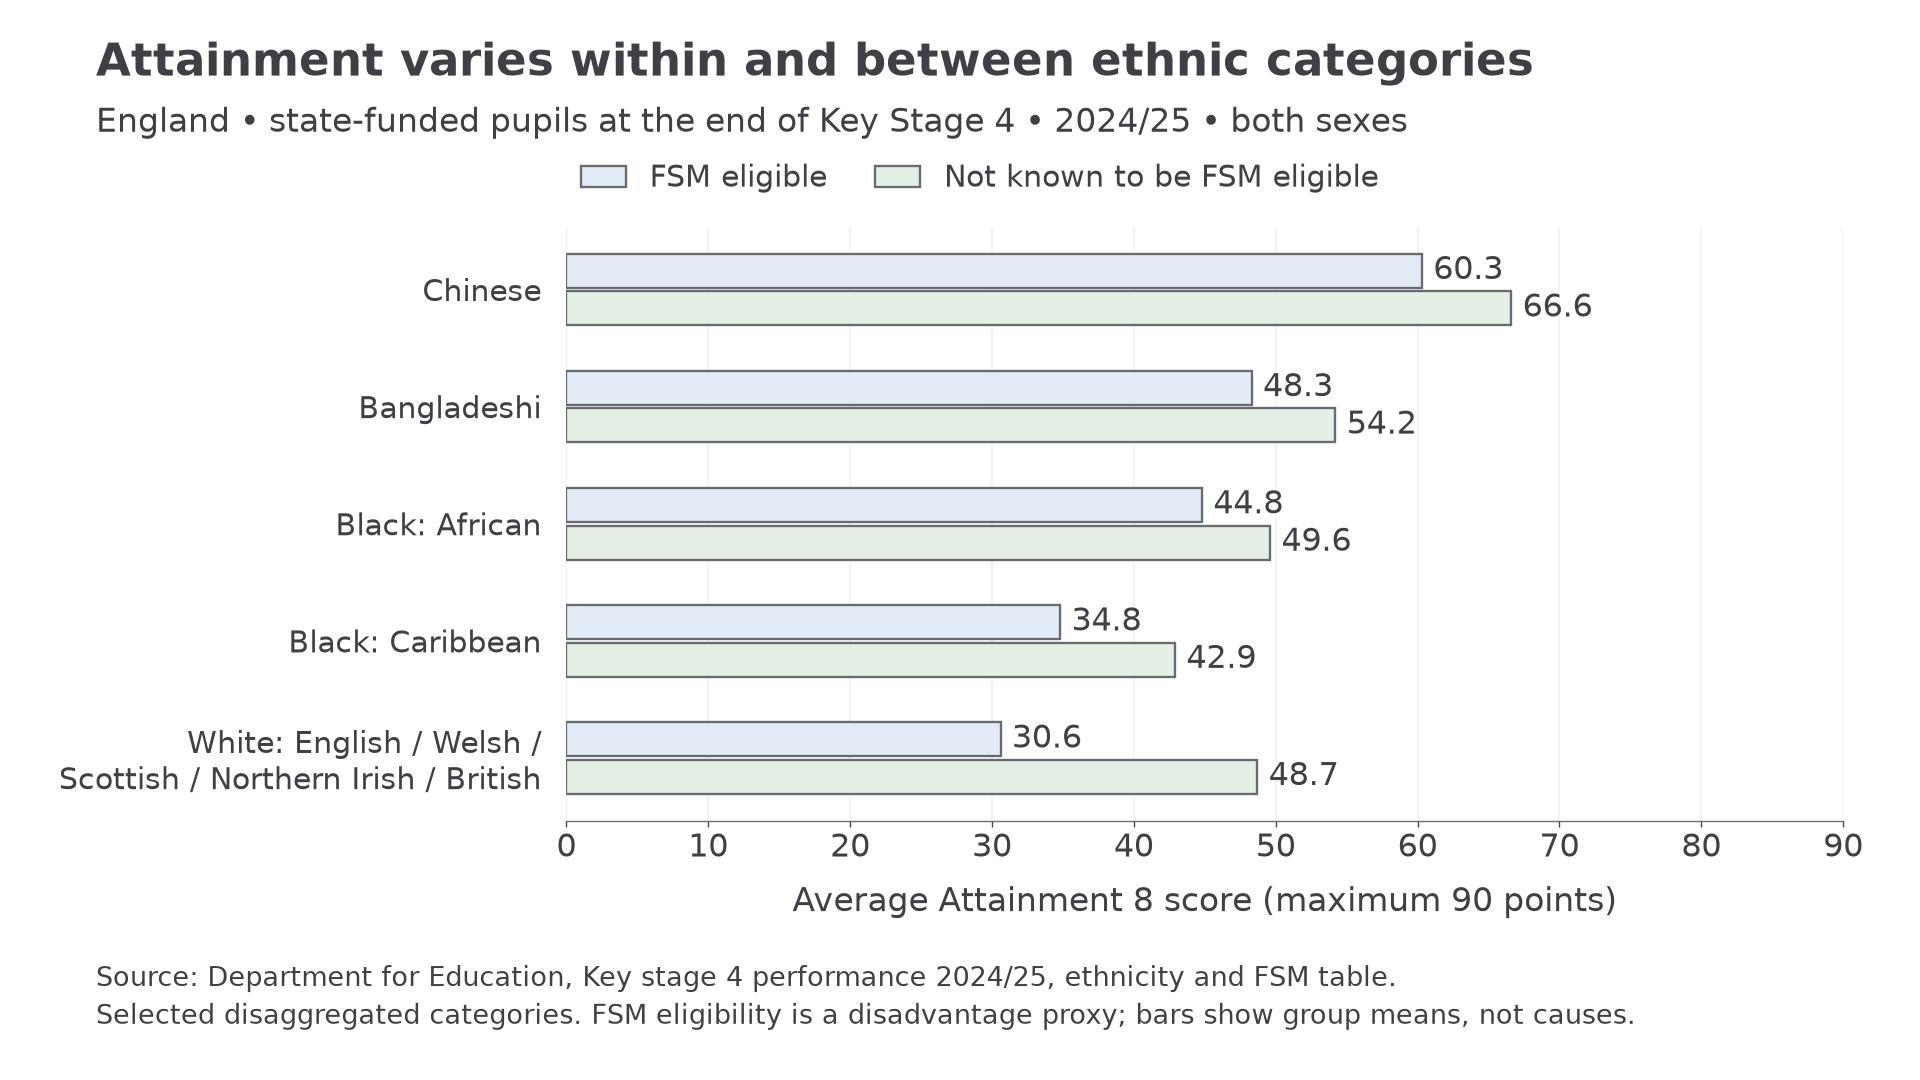
The bars show average Attainment 8 points, not percentages passing examinations. Source: DfE, 2024/25 England state-funded end-of-KS4 pupils, both sexes combined; selected categories from the ethnicity and FSM table. FSM eligibility is an economic-disadvantage proxy. The chart selects groups to teach comparisons, rather than presenting every recorded ethnicity.
To interpret a difference, keep the measure and comparator fixed. Comparing the African and Caribbean overall averages gives 47.9 − 39.2 = 8.7 Attainment 8 points. That comparison describes a difference within the broad Black category. It does not identify whether family resources, school experiences, location or other influences produced it. A changing mix of subgroups can also change a broad category's average without the same change occurring within every subgroup.
Continue this lesson.
You’re previewing NovaLearn without an account. Create a free account to read the rest.
Create free account