02 Section B, Key question 1 - Social class and life chances (part 1)
People can do different jobs without having equal security, resources or opportunities. This lesson explains how social class relates to work, health, housing and education, and how these advantages or disadvantages can accumulate. You will also learn to distinguish evidence of a pattern from an explanation of why it occurs.
Class, resources and inequality
Social inequality concerns unequal access to valued resources and opportunities, rather than every difference between people.
Social difference means a variation such as doing different occupations. Social inequality exists when positions bring systematically unequal rewards, power or chances: for example, one worker can negotiate their hours while another risks losing shifts if they refuse an employer's demands. Difference can therefore become a basis of inequality, but difference alone does not establish disadvantage.
Social class
A position in a system of economic and social relationships, often measured through occupation and employment relations. Class includes how people earn a living, their authority at work and their access to resources; it is not simply a salary band.
A relational approach asks who owns productive resources, who employs others and who must sell their labour. A small employer and an employee might receive similar incomes but exercise different control over work. An occupational approach groups positions such as managerial, professional, intermediate and routine work. These approaches draw attention to different aspects of class; neither requires assuming that everyone in a category has the same lifestyle or sees themselves in the same way.
Income is a flow of money over a period, including wages, benefits or investment returns. Wealth is a stock of assets at a particular time, such as savings, property and pensions, with relevant debts deducted when measuring net wealth. Wealth can generate income and cushion a loss of earnings; high current earnings do not necessarily mean substantial accumulated wealth.
Consider this original example. Two employees each earn £30,000 a year. One rents and has no savings; the other owns a home outright and has £40,000 in savings. Their employment income is equal, but their wealth and ability to survive unpaid time differ. We cannot infer either person's precise occupational class from that salary alone. To classify their work, we would also need information about their occupation and employment relations.
Employment relations and rewards
Class position can affect the terms on which people work as well as the amount they earn.
The National Statistics Socio-economic Classification (NS-SEC) is the Office for National Statistics' occupational classification. It uses occupation and characteristics such as employee or self-employed status and supervisory responsibilities to describe employment relations. Its categories distinguish higher and lower managerial/professional positions, intermediate occupations, small employers and own-account workers (self-employed without employees), lower supervisory/technical work, semi-routine work, routine work, and never-worked/long-term-unemployed positions. Census reporting also identifies full-time students separately. These are positions, not judgements of a person's worth.
ONS distinguishes a service relationship, typical of higher professional and managerial employment, from a labour contract, typical of routine employment. A service relationship can combine present salary with career progression, longer-term security and discretion over work. A labour contract exchanges defined time or tasks for a wage, often with closer supervision. Intermediate positions combine features of both. These are typical relationships, not guarantees: a professional can have a temporary contract and a routine worker can have stable employment. Source: ONS NS-SEC user guide.
Employment security concerns the predictability and continuity of work and earnings. Autonomy means discretion over how work is done. Working conditions include scheduling, physical demands, exposure to hazards, supervision and opportunities for training. For example, an unpredictable shift pattern can make childcare difficult to arrange, which may restrict a worker's ability to take a course. The mechanism is a constraint on time and resources, not an assumption that the worker lacks ambition.
To assess inequality at work, compare pay, predictability, authority, autonomy and progression. A salary comparison alone leaves much of the employment relationship unmeasured.
Pay comparisons need a specified measure. ONS's Annual Survey of Hours and Earnings (ASHE) release, published 23 October 2025, estimated April 2025 median gross weekly pay at £766.60 for full-time and £280.00 for part-time UK employee jobs on adult rates with pay unaffected by absence. Median is the middle value; gross pay is before deductions. Full-time means more than 30 paid hours weekly, or at least 25 for teaching professions. These provisional figures describe employee jobs, not households or self-employed people. They compare working patterns, not class categories; different paid hours and occupational composition matter. A larger weekly amount cannot by itself establish a higher hourly rate or a more secure contract. Source: ONS employee earnings, 2025.
For a class-origin comparison, the Social Mobility Commission's December 2025 report found broadly persistent differences in mean hourly earnings by background among UK 25–29-year-olds over 2014–2024. The mean is the arithmetic average; earnings here are adjusted for inflation to allow for price changes. The Labour Force Survey, a sample survey of the UK labour market, supplies this measure, excluding the self-employed and those without earnings. Comparing hourly pay avoids treating different weekly hours as the entire pay gap; it still does not prove a particular cause. Source: SMC earnings analysis, method, indicator 3.4.
Changing work and social mobility
Changes in the jobs available can alter opportunities, while unequal chances of obtaining those jobs may persist.
ONS's Census comparison, published 8 December 2022, found that manufacturing's share of employed usual residents aged 16 and over in England and Wales fell from 8.9% in 2011 to 7.3% in 2021. Human health and social work rose from 12.5% to 14.7%. Census 2021 employment refers to the week before 21 March. It occurred during pandemic restrictions and furlough, so interpretation needs care. Source: ONS industry and occupation.
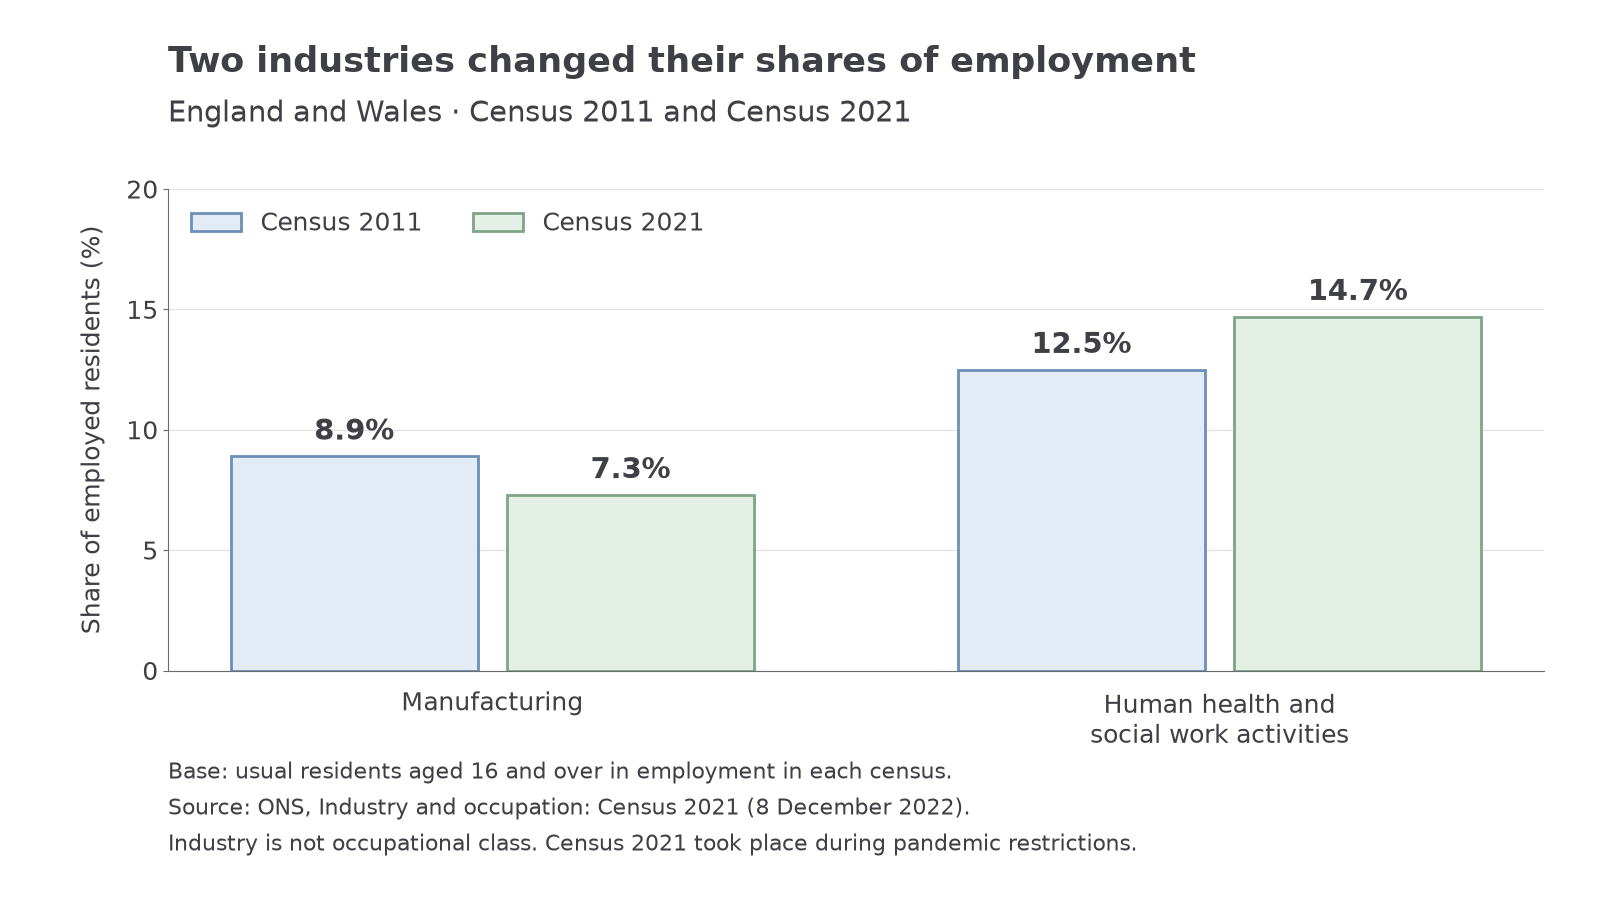
Manufacturing and human health/social work shares of employed usual residents aged 16 and over in England and Wales, Census 2011 and Census 2021. Industry is not occupational class.
An industry is what an organisation does; an occupation is the work a person does. Hospitals employ senior managers, professionals, administrators and routine workers. Growth in a service industry therefore does not mean every new position is professional, and manufacturing employment does not consist solely of manual jobs. The chart describes a change in employment structure, not a direct count of class mobility.
Social mobility is movement between social positions. Intergenerational mobility compares a person's position with their parents'; intragenerational mobility occurs within their own working life. Upward movement might mean the child of a routine worker entering a professional occupation; downward movement is also possible. Absolute occupational mobility counts the proportion in a different class from their parents. Relative mobility compares the chances of reaching destinations from different origins. Expanding professional employment can increase upward movement without equalising those chances.
The Social Mobility Commission's December 2025 report analysed pooled Labour Force Survey data. Among UK 25–29-year-olds, the share in higher or lower professional occupations rose from 36.1% in 2014–2016 to 48.2% in 2022–2024. The reported higher-professional destination percentages for lower-working-class and higher-professional origins were 7.8% and 30.9% in the later period. Each origin group's percentage uses that group as its denominator; origin is the main household earner's occupation when the respondent was 14. Tests did not establish a statistically significant widening of the origin gap. These repeated survey averages do not track the same people through promotions or measure their final careers. Source: SMC 2025, Figure 4.8 notes, method, indicator 3.3.
Continue this lesson.
You’re previewing NovaLearn without an account. Create a free account to read the rest.
Create free account