02 Section B, Key question 1 - Gender inequalities (part 2)
Gender inequalities involve more than whether women and men have paid jobs. This lesson examines the work people enter, their pay and authority, the unpaid work they perform, and how these patterns affect opportunities later in life. You will learn to describe change without overlooking persistent inequality, and to explain what evidence can establish about its causes.
Access to paid employment
Employment gives people income and resources, but being outside paid employment does not mean that someone does no useful work.
Gender concerns the social meanings, expectations and relationships associated with being a woman, a man or another gender identity. Sex concerns biological classification, commonly recorded as female or male in these data. These ideas are connected, but they are not interchangeable measurements: a table classified by sex cannot silently become evidence about every gender identity. The official sources below generally compare their female and male categories, often using the labels women and men. Their findings do not separately describe transgender or non-binary people's experiences.
Gender inequality
Unequal access to valued resources, opportunities or power associated with gender. A difference becomes evidence of inequality when it concerns advantages and disadvantages, rather than simply different activities.
For example, two people choosing different hobbies is a difference. A promotion rule that excludes a person who cannot stay late because they provide necessary care can create unequal access to authority and income. Identifying a pattern does not yet establish whether it arose through discrimination, household arrangements, economic conditions or several processes together.
The employment rate is the percentage of a specified population who are in paid employment. ONS Labour Force Survey annual estimates for UK residents aged 16–64 show the female rate increasing from 52.7% in 1971 to 72.3% in 2025, while the male rate fell from 91.4% to 77.9%. The gap therefore narrowed substantially, through changes affecting both groups. These are annual estimates from the series available in September 2026, not a claim that every decade or individual experienced the same change. ONS female employment series, ONS male employment series.
More women in employment means more women have access to earnings and potentially financial independence. It does not demonstrate equality of pay, job security or promotion among those employed. Educational opportunities, changing expectations about women's work, demand for workers and care arrangements are possible influences on employment; the two series alone do not separate their effects.
Employment, unemployment and economic inactivity are different categories. An unemployed person is without work and meets the survey's availability and job-search conditions; an economically inactive person is outside both employment and unemployment, for example because they are studying, unable to work or caring for someone. Someone doing unpaid care may be economically inactive while performing demanding work. A lower employment rate therefore cannot automatically be described as a higher unemployment rate. Survey estimates also have sampling uncertainty, so small short-term changes need caution.
Occupations and seniority
People can participate in paid work while remaining unevenly distributed across different jobs and levels of authority.
Horizontal occupational segregation means women and men are concentrated in different kinds of work. Vertical occupational segregation means they are unevenly distributed across positions of seniority and power. Horizontal segregation concerns the kind of job; vertical segregation concerns the level reached. Both can operate together.
For historical evidence, an ONS analysis published in October 2017 described women as more likely to work in caring, leisure and administrative roles, while men predominated in skilled trades. This illustrates sorting across occupational groups in the evidence available at that time; it is not an estimate of the 2026 workforce, and neither group contains identical jobs or identical workers. ONS occupational analysis.
A possible mechanism begins before recruitment. Gendered expectations from families, peers and education can make some subjects and occupations seem more appropriate or attainable. Recruitment networks and employers' assumptions can reinforce the sorting. If work associated with caring is valued less highly in the pay structure, segregation can translate into unequal earnings. This is a sociological explanation connecting social arrangements to outcomes; the occupational distribution itself does not prove which mechanism produced it. Caring work is skilled and socially valuable, even where its pay is low.
Seniority requires separate evidence. The FTSE Women Leaders Review 2026, reporting positions at 31 October 2025, found women held 42.7% of FTSE 350 board seats, but 15.4% of executive director positions. A board includes non-executive directors, who help oversee a company without holding the same day-to-day executive responsibilities. These percentages have different denominators: neither means that 42.7% or 15.4% of all working women held these posts. They concern a specific group of large listed companies, not every employer. FTSE Women Leaders Review, 2026, summary and board analysis.
Glass ceiling
Barriers that restrict progression into senior positions even when there is no openly stated rule excluding a group.
The concept directs attention to promotion practices, informal networks and assumptions about who can lead. For example, treating uninterrupted long working hours as the sole sign of commitment may disadvantage a capable employee with care responsibilities. Women can gain representation at one level while barriers remain at another. A seniority gap is consistent with these barriers, but a headcount cannot by itself prove discrimination in each appointment: career histories and promotion decisions need investigation.
In this original illustration, women hold most receptionist roles in a hotel chain, while men hold most maintenance roles. Within both departments, men occupy most senior management posts. The first comparison is horizontal segregation because it compares occupations. The second is vertical because it compares authority within the organisation. Neither pattern means every man is senior or every woman is lower paid.
Interpreting the gender pay gap
A gender pay gap compares the earnings of groups, so its meaning depends on the earnings measure and the employees included.
The median is the middle value when earnings are arranged in order. ONS calculates its headline gender pay gap from median hourly earnings excluding overtime: subtract the female median from the male median, divide by the male median, then express the result as a percentage. A positive gap means the female median is lower. A negative gap means it is higher for that comparison.
In this original calculation, male median hourly pay is £20 and female median hourly pay is £18. The difference is £2. Dividing £2 by £20 and multiplying by 100 gives a 10% gap. The male median is the reference value. This says nothing about which particular man or woman earns more, and it is not a comparison of weekly earnings: different hours worked can produce further differences in weekly income.
The ONS Annual Survey of Hours and Earnings (ASHE) estimates for UK employee jobs in April 2025, published in October 2025, were 12.8% for all employees, 6.9% for full-time employees, and −2.9% for part-time employees. The values concern median hourly earnings excluding overtime, on adult rates with pay unaffected by absence; 2025 estimates were provisional. ASHE full-time means over 30 paid hours a week, or at least 25 for teaching professions. Self-employed people are outside this employee comparison. The revised April 2024 figures were 13.1% for all employees and 7.1% for full-time employees: improvement can coexist with a remaining gap. ONS, Gender pay gap in the UK: 2025.
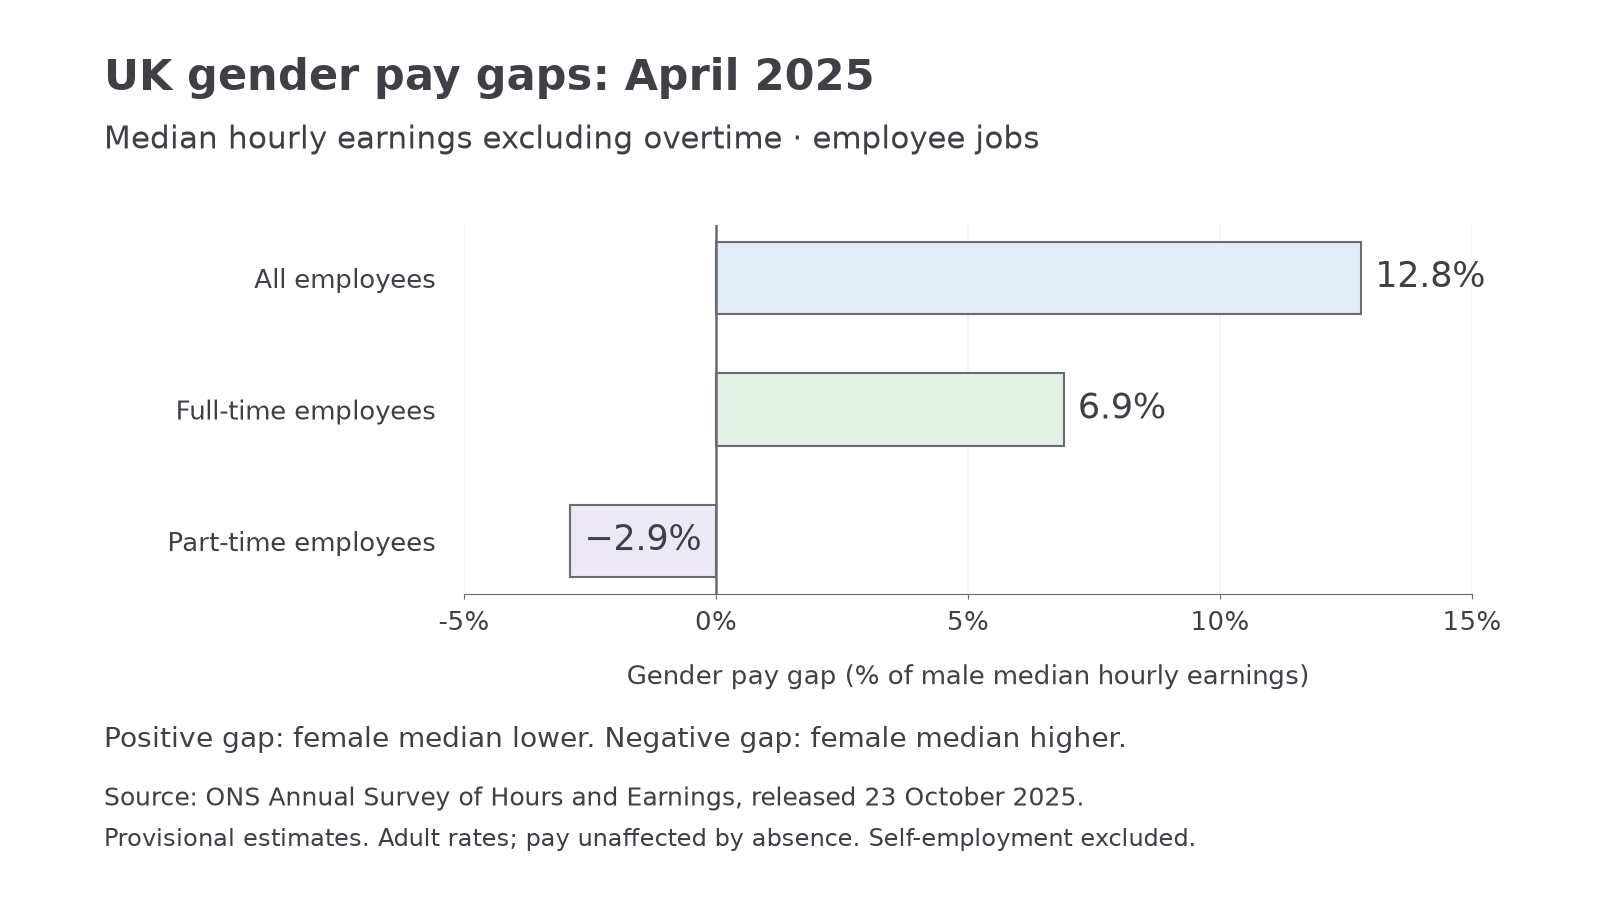
ONS ASHE provisional April 2025 estimates. Each bar compares the female and male medians within its labelled employee group; a negative value favours the female median.
Why can the all-employee gap exceed either subgroup gap? Full-time and part-time employees are mixed in different proportions within the male and female groups. Part-time employment tends to have lower hourly pay, and a larger share of women work part-time. Bringing the groups together can therefore place the female overall median further below the male overall median. The all-employee gap is not the simple average of the two subgroup gaps; medians depend on the distribution of earnings. The negative part-time gap consequently does not cancel the overall inequality. ONS explanation of employee-group composition.
Unequal pay for the same or equal work is a different question: are comparable workers rewarded differently for that work? The unadjusted pay gap mixes occupations, seniority, employment histories and working patterns. A pay gap can exist where workers receive the same rate within each job but access to higher-paid jobs differs. Equally, a small overall gap could conceal discriminatory treatment of particular workers. Neither “the gap proves every employer pays women less for identical work” nor “different jobs explain the gap, so no inequality exists” is justified. Occupational sorting and access to senior posts are themselves possible forms of inequality.
Continue this lesson.
You’re previewing NovaLearn without an account. Create a free account to read the rest.
Create free account