02 Section B, Key question 1 - Ethnic inequalities (part 3)
Ethnic inequalities differ between groups, within groups and across areas of life. You will interpret evidence about employment, occupations and pay, compare housing, education and health, and explain how unequal opportunities can shape life chances. You will also learn why a statistical gap and evidence of discriminatory treatment answer different questions.
Ethnicity, difference and inequality
Ethnic differences become social inequalities when they involve unequal access to valued resources, opportunities or treatment.
Ethnicity concerns social identities associated with shared ancestry, histories and cultural practices. It is distinct from nationality, citizenship and religion: a British citizen may identify as Black Caribbean; people with Pakistani heritage may have different religious identities. Ethnic categories describe social classifications, not fixed biological abilities. Racialisation occurs when people attach supposedly racial meanings to a group and treat its members through those meanings.
Ethnic inequality
A patterned difference in resources, opportunities or treatment associated with ethnic group membership. A group pattern does not describe every member of the group.
For example, different languages spoken at home are differences. If an employer rejects an otherwise suitable applicant because of an ethnic stereotype, that is unequal treatment. A language difference could become relevant to inequality if services fail to make essential information accessible, but the existence of several languages is not itself disadvantage.
Use categories as precisely as the evidence permits. Indian, Pakistani, Bangladeshi and Chinese populations do not have one common employment experience. Black African and Black Caribbean categories can also conceal variation in migration histories, age and class. A source reporting a combined category cannot support an invented figure for one of its subgroups. Likewise, “White” and “White British” are different statistical categories.
An intersection is a combination of social positions shaping an experience: ethnicity may interact with gender, class, age and migration history. Within a named ethnic group, a recently arrived graduate seeking recognition of an overseas qualification may face different barriers from a British-born professional or a young school-leaver. These are illustrative possibilities, not claims that all people with those identities have those experiences.
Reasoning therefore starts with three questions: what outcome is unequal, who is being compared, and how was that outcome measured? Calling every minority group disadvantaged in every respect would prevent us from seeing both substantial inequalities and important differences.
Employment and unemployment patterns
Employment and unemployment rates measure different aspects of participation in paid work.
An employment rate gives the proportion of a specified population in work. An unemployment rate gives the proportion of the economically active population who are unemployed. In these statistics, unemployed people are out of work, available to start within two weeks, and either have sought work in the previous four weeks or are waiting to start a job. Economically active people are employed or unemployed; people outside that labour force are economically inactive. For example, a student not looking for work is inactive rather than unemployed. Someone can be out of paid employment without meeting the unemployment definition.
The Annual Population Survey figures below describe Great Britain in 2022, rather than the UK in 2026. Employment concerns people aged 16–64. Unemployment concerns economically active people aged 16 and over. The published percentages are rounded to whole numbers.
| Published ethnic category | Employment rate | Unemployment rate |
|---|---|---|
| Indian | 77% | 4% |
| Pakistani, Bangladeshi combined | 61% | 9% |
| Black combined | 69% | 7% |
| Mixed combined | 69% | 6% |
| White British | 76% | 3% |
| White other | 82% | 4% |
Sources: government Ethnicity facts and figures, employment and unemployment, using the Annual Population Survey.
[DIAGRAM: asset_slug: ethnic-unemployment-gb-2022; file: ethnic-unemployment-gb-2022.png; recommended_method: matplotlib; description: Unemployment rates for six published ethnic categories in Great Britain in 2022, among economically active people aged 16 and over; caption: Great Britain unemployment rates, 2022: percentages of each economically active ethnic group aged 16 and over.]
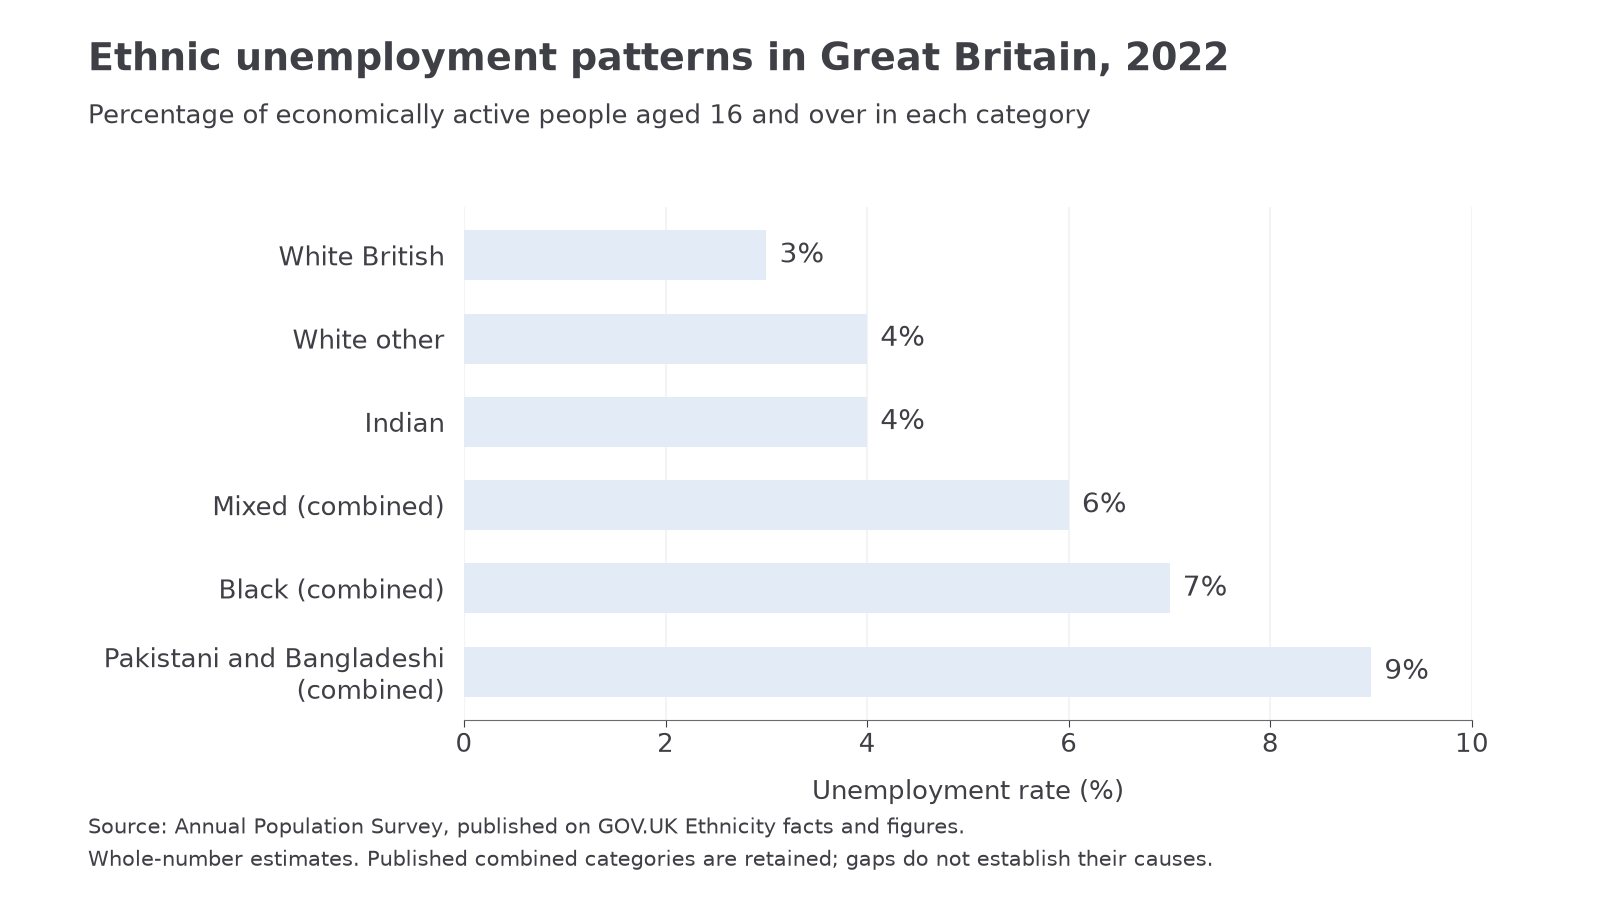
The unemployment comparison is 9 − 3 = 6 percentage points, while 9 ÷ 3 = three times the rate, using rounded figures. These are different descriptions of the same comparison. Neither means that the combined Pakistani and Bangladeshi population made up 9% of all unemployed people: the denominator is the economically active population within that category.
Do not subtract the 61% employment rate from 100% and call the result unemployment. That remainder includes inactivity and uses a different age range. Participation may be affected by study, caring, illness and barriers to finding suitable work; this table does not identify their separate effects.
Patterns can improve while inequalities remain. In this series, the combined Pakistani and Bangladeshi employment rate rose from 44% in 2004 to 61% in 2022. Over those dates, the Black combined unemployment rate fell from 13% to 7%. Changing category questions and sampling uncertainty limit comparisons; the reported 2022 gaps still matter.
Occupational position and pay gaps
Having a job does not tell us its occupational position, pay or security.
Occupational position concerns the kind of work someone does and its location in a hierarchy of skills, rewards or authority. Professional occupations often require specialist qualifications; elementary occupations generally involve routine tasks. These categories describe jobs, not the worth or ability of workers. Occupational segregation means groups are unevenly distributed across occupations.
In the UK Annual Population Survey for 2021, 39.8% of Indian workers were in professional occupations, compared with 21.9% of workers in the combined Pakistani and Bangladeshi category and 24.7% of White British workers. The population includes employees and self-employed workers. Black workers were more concentrated in elementary occupations: 13.2%, compared with 9.0% of White British workers. The source flags a collection issue affecting some detailed occupational data, so these survey estimates warrant caution. Government occupational statistics.
A greater share in professional work may improve access to earnings, autonomy and progression. However, an occupational category is not a direct measure of job security or wealth. The high employment rate for White other people therefore does not establish an advantage on every dimension of work.
Median pay is the middle value when pay is ordered; it is not the pay every worker receives. ONS's 2022 analysis of employees aged 16 and over found that, within England and Wales, Chinese and Indian employees had higher median gross hourly pay than White British employees, while Bangladeshi and Pakistani employees had lower pay. Broad “Asian” averages conceal these contrasting outcomes. Hourly pay excludes self-employed earnings and does not reveal total household income or accumulated wealth. ONS pay analysis.
Raw and adjusted gaps
A raw gap compares observed outcomes between groups. An adjusted gap compares outcomes after a statistical model accounts for selected measured characteristics. The remaining difference is a statistical residual, sometimes described as an ethnic penalty in labour-market research.
For example, a raw pay gap may partly reflect different occupational distributions or age profiles. Adjustment can ask how groups compare when selected characteristics, such as occupation and qualifications, are held constant. It can alter the direction as well as the size of a gap. ONS found that, among UK-born employees in 2022, the broad Black category moved from a raw pay advantage of 6.5% to an adjusted disadvantage of 5.6% against UK-born White employees. ONS cautions that declining survey samples increase uncertainty in 2020–22 estimates.
Neither comparison alone measures the full extent of discrimination. A raw gap mixes several influences. A residual can reflect discrimination but also unmeasured circumstances or modelling choices. Conversely, controlling for occupation may remove part of the very pathway through which earlier discriminatory barriers affected pay. Zwysen, Di Stasio and Heath's research explains why survey penalties and experimentally observed hiring discrimination should be distinguished.
Consider an original illustration: two equally qualified applicants are channelled into different occupational grades. Comparing pay only within the eventual grade might produce little gap, while overlooking unequal access to the better grade. The correct inference is to examine both allocation to jobs and pay within jobs, rather than declaring that statistical adjustment has settled the causal explanation.
Continue this lesson.
You’re previewing NovaLearn without an account. Create a free account to read the rest.
Create free account