4.2.3 - Correlations
Correlations show whether two measured variables vary together, not whether one produces the other. You will interpret positive, negative and zero relationships, distinguish correlation from experiment, and identify when a scatter pattern supports a prediction. Evaluation centres on third variables, direction of effect and the value of studying naturally occurring measures that would be difficult or unethical to manipulate.
What correlations do
A correlation is used when a psychologist wants to know whether two measured things are related. The same cases must supply the two measurements, so the researcher can ask whether high values on one measure go with high or low values on the other.
Correlation
A correlation is a statistical relationship between two variables. It shows whether the variables tend to change together, but it does not show that one variable causes the other.
Co-variable
A co-variable is one of the two measured variables in a correlation. The term is used because neither variable is manipulated by the researcher.
Experiment
An experiment investigates cause and effect by comparing levels or conditions of an independent variable and measuring a dependent variable, with control of other variables where possible.
In a correlational investigation, every participant or case usually contributes a pair of scores:
| Person or case | Sleep last night (hours) | Attention errors (count) |
|---|---|---|
| Student 1 | 5 | 10 |
| Student 2 | 7 | 6 |
| Student 3 | 8 | 3 |
The researcher then asks: as one co-variable changes, what tends to happen to the other? Here the person with 5 hours of sleep made 10 errors, whereas the person with 8 hours made 3. Keep the pairs together: independently sorting each column would invent a different relationship. These three hypothetical cases illustrate the method; they are far too few to establish a dependable population pattern.
For example, Dr Singh records how many hours each student slept last night and how many attention errors they make in a concentration task. If students who slept longer tend to make fewer errors, Dr Singh has found a relationship between the two co-variables. He has not manipulated sleep or allocated students to experimental conditions.
A correlation is therefore useful when the researcher wants to analyse a naturally occurring relationship. It is not a shortcut experiment.
Reading relationships
To analyse the relationship between co-variables, psychologists look at direction and strength.
Scattergram
A scattergram is a graph that plots paired scores for two co-variables. Each dot represents one participant, observation or case.
Positive correlation
A positive correlation occurs when, as one co-variable increases, the other co-variable also tends to increase.
Negative correlation
A negative correlation occurs when, as one co-variable increases, the other co-variable tends to decrease.
Zero correlation
A zero correlation occurs when there is no consistent straight-line relationship between the two co-variables.
The basic reading skill is:
| Pattern | What it means | Psychology example |
|---|---|---|
| Positive correlation | As one co-variable increases, the other tends to increase. | More hours spent revising is associated with higher test scores. |
| Negative correlation | As one co-variable increases, the other tends to decrease. | More hours of sleep is associated with fewer attention errors. |
| Zero correlation | There is no consistent straight-line relationship between the co-variables. | Shoe size is not consistently associated with memory score. |
[DIAGRAM: asset_name: Three scatter patterns; asset_slug: ps10_correlations_patterns_v2; description: Hypothetical paired sleep and attention data showing a strong negative trend, a weaker positive trend and no straight-line trend. Each point is one student.]
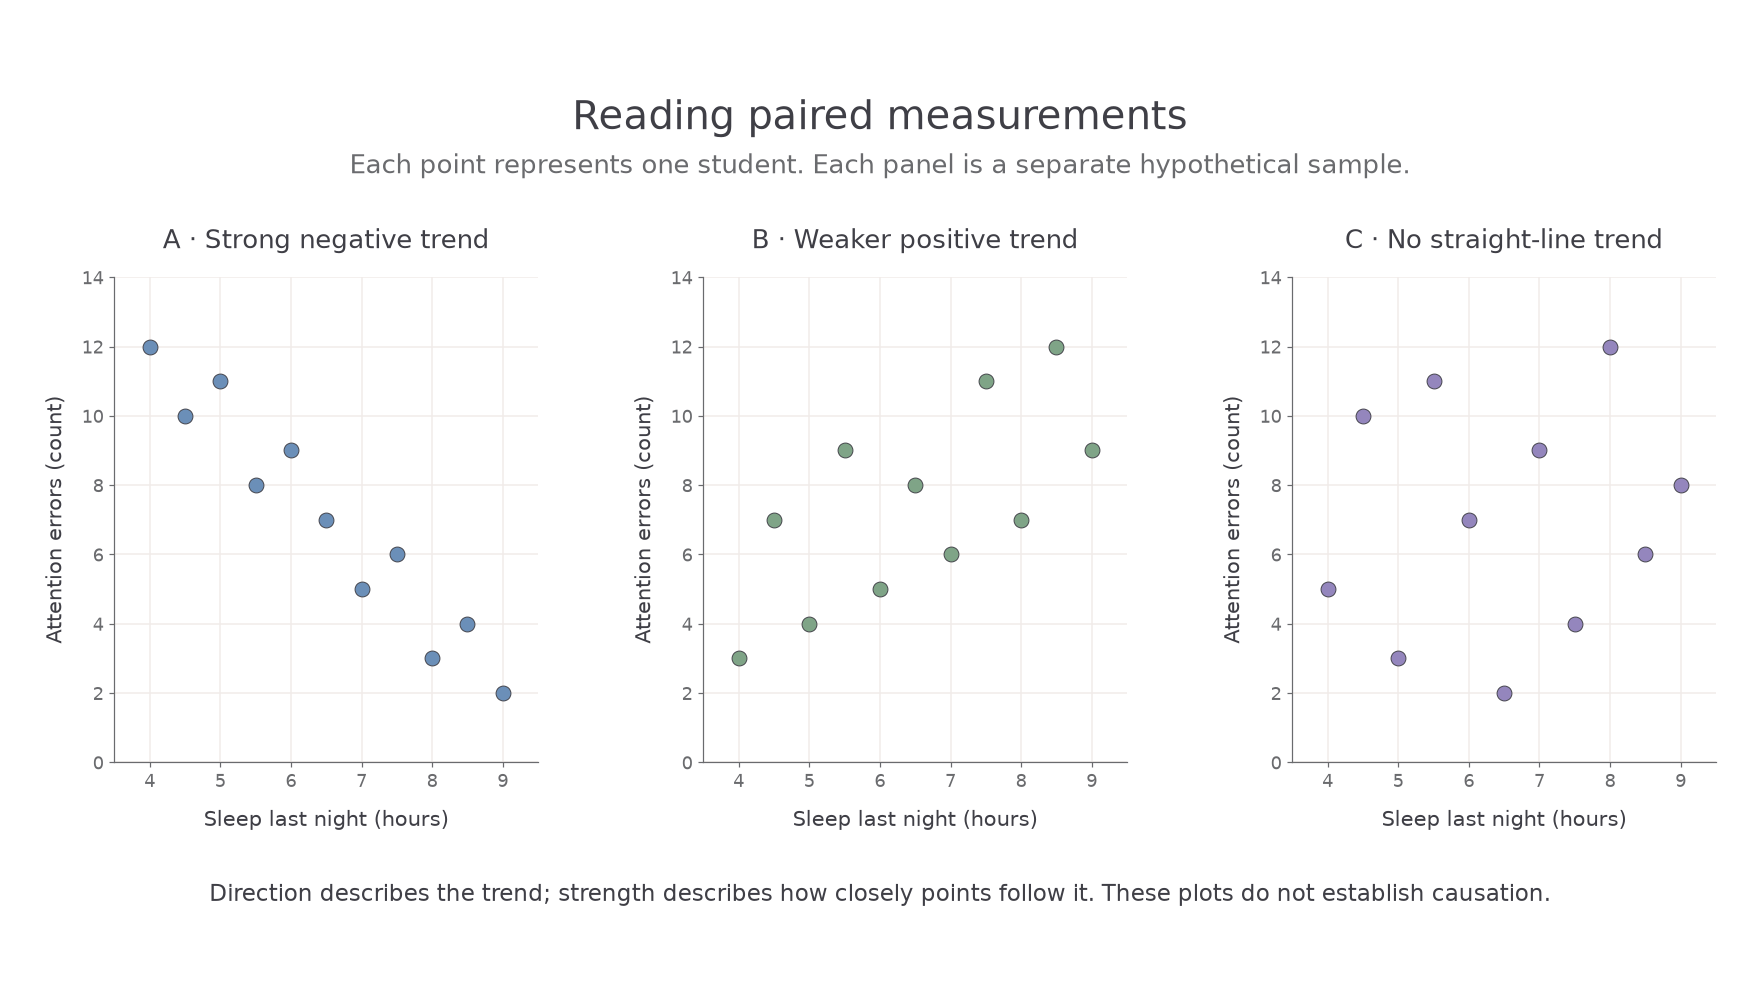
To read the left plot, locate a point using both axes: a student sleeping 5 hours made 11 attention errors. As sleep increases across the sample, errors generally decrease. The trend is negative even though not every point lies on a line. The middle plot is positive but more scattered; the right plot has no consistent upward or downward straight-line trend. These are separate invented samples, not evidence that sleep really has these three effects.
Direction is not the same as strength. A negative correlation can be strong if the points form a close downward pattern. A positive correlation can be weak if the points are widely scattered. Use how closely points cluster around the trend, rather than its steepness, to judge strength: changing an axis scale can make a trend look steeper without changing the association. In this method lesson, focus on the idea of a relationship between co-variables; a later data-handling lesson goes further into correlation coefficients and numerical interpretation.
Good correlational wording is cautious:
| Weak wording | Better wording |
|---|---|
| "Revision causes high marks." | "Revision time and test score are positively correlated." |
| "Sleep prevents attention errors." | "Sleep duration and attention errors are negatively correlated." |
| "Stress has no effect on illness." | "There is little or no correlation between stress score and illness reports in this sample." |
Notice the pattern: name both co-variables, identify the direction, and avoid causal language unless an experiment has actually tested causation.
Correlations and experiments
The difference between correlations and experiments is one of the most important AQA research-methods distinctions.
Independent variable
The independent variable is the variable that differs between experimental conditions. In many experiments it is manipulated by the researcher.
Dependent variable
The dependent variable is the measured outcome in an experiment.
Continue this lesson.
You’re previewing NovaLearn without an account. Create a free account to read the rest.
Create free account