4.2.3.2 - Presentation and display of quantitative data
Tables and graphs make numerical patterns visible, but the correct display depends on what the values represent. You will construct and interpret tables, bar charts, histograms and scattergrams, distinguishing separated categories from continuous intervals and relationships. Evaluation focuses on accurate axes, labels and scales so that a display communicates the evidence without exaggerating differences or hiding uncertainty.
Why display quantitative data?
Psychologists collect quantitative data so that behaviour and experience can be summarised numerically. A display turns those numbers into something a reader can inspect. It helps answer questions such as: Which condition had the higher score? How spread out were the scores? Do two co-variables appear to be related?
Quantitative data
Quantitative data are numerical data that can be counted, measured, ranked or statistically analysed.
Data display
A data display is an organised presentation of data, usually as a table or graph, designed to make values, comparisons or patterns easier to understand.
Graph
A graph is a visual display of numerical data that uses plotted points, bars, axes or scales to show patterns or comparisons.
Co-variable
A co-variable is one of the two measured variables in a correlational analysis, such as hours of sleep and concentration score.
A display is not the same thing as a statistical conclusion. A bar chart may show that one condition had a higher mean than another, but it does not by itself prove that the difference is significant. A scattergram may show a positive relationship, but it does not prove that one variable caused the other. Good exam answers keep this boundary clear.
For this specification point, AQA names five display terms:
| Display term | Main job | What the student should notice |
|---|---|---|
| Table | Shows exact values in rows and columns. | Values, labels, units, totals and descriptive statistics. |
| Graph | Umbrella term for a visual display of numerical data. | Whether the chosen graph matches the type of data. |
| Bar chart | Compares separate categories or conditions. | Bar height/length, separated bars, labelled axes. |
| Histogram | Shows frequencies for scores grouped into continuous intervals. | Touching bars, class intervals, where scores cluster. |
| Scattergram | Shows the relationship between two co-variables. | Direction, strength and possible outliers, not causation. |
The exam skill is rarely just naming the display. It is usually naming it and justifying why it fits the data. The fastest route is to ask: "Am I comparing categories, showing grouped frequencies, or looking for a relationship between two variables?"
Tables: precise numerical summaries
A table is useful when the reader needs to compare exact numerical values.
Table
A table presents data in labelled rows and columns so that exact numerical values can be read and compared.
Tables are best when the reader needs precise numbers. In psychology, a results table often summarises descriptive statistics, such as means, medians, ranges or standard deviations, for each condition or group. Raw paired scores can also be tabulated before analysis; each row must clearly identify a case or category.
A good table has:
- a clear title that says what the data are about;
- row and column headings that identify the variables, conditions or groups;
- units where needed, such as "seconds", "rating out of 10" or "score out of 20";
- consistent rounding, such as all means to one decimal place;
- enough information to interpret the pattern without clutter.
Constructing a frequency table
For these ten recall scores, 2, 4, 4, 5, 7, 7, 7, 9, 9, 10, list each observed score in order, tally each occurrence once and total the frequencies:
| Words recalled | Frequency |
|---|---|
| 2 | 1 |
| 4 | 2 |
| 5 | 1 |
| 7 | 3 |
| 9 | 2 |
| 10 | 1 |
| Total | 10 |
The total must equal the number of observations: . A frequency of 3 at score 7 means three participants each recalled seven words, not that seven people recalled three words. The mode is 7. The mean can be recovered without expanding the list: multiply each score by its frequency, then divide the total score by the total frequency. Here words.
Comparing conditions
Table 1. Word recall after two revision conditions, maximum score = 20
| Revision condition | Mean words recalled | Range of scores |
|---|---|---|
| Silent revision | 14.2 | 7 |
| Revision with phone notifications | 10.1 | 11 |
This table is useful because it shows exact values. The silent revision condition has the higher mean, so participants recalled more words on average. The phone notification condition has the larger range, so scores were more spread out. A careful interpretation would be:
Participants recalled more words on average after silent revision than after revision with phone notifications. Scores were also less variable in the silent condition. However, the table alone does not show whether the difference is statistically significant.
That final sentence matters. A display helps interpretation, but an inferential test would be needed before claiming a statistically significant difference.
Bar charts: comparing categories
Separate categories can be compared by drawing one bar for each category.
Bar chart
A bar chart is a graph in which separate bars represent separate categories, groups or conditions. The height or length of each bar shows a frequency, percentage or summary statistic such as a mean.
Bar charts are used when the x-axis shows distinct categories rather than a continuous scale. In psychology, common categories include experimental conditions, participant groups, questionnaire response options or types of behaviour.
For a vertical bar chart:
- the x-axis usually names the categories or conditions;
- the y-axis shows the numerical value, such as frequency, percentage or mean score;
- the bars are separated by gaps because the categories are separate;
- the y-axis should usually start at zero when bar height is used to compare size, otherwise the difference can look exaggerated;
- both axes need precise labels, not vague labels such as "result" or "score".
Worked AQA-style example:
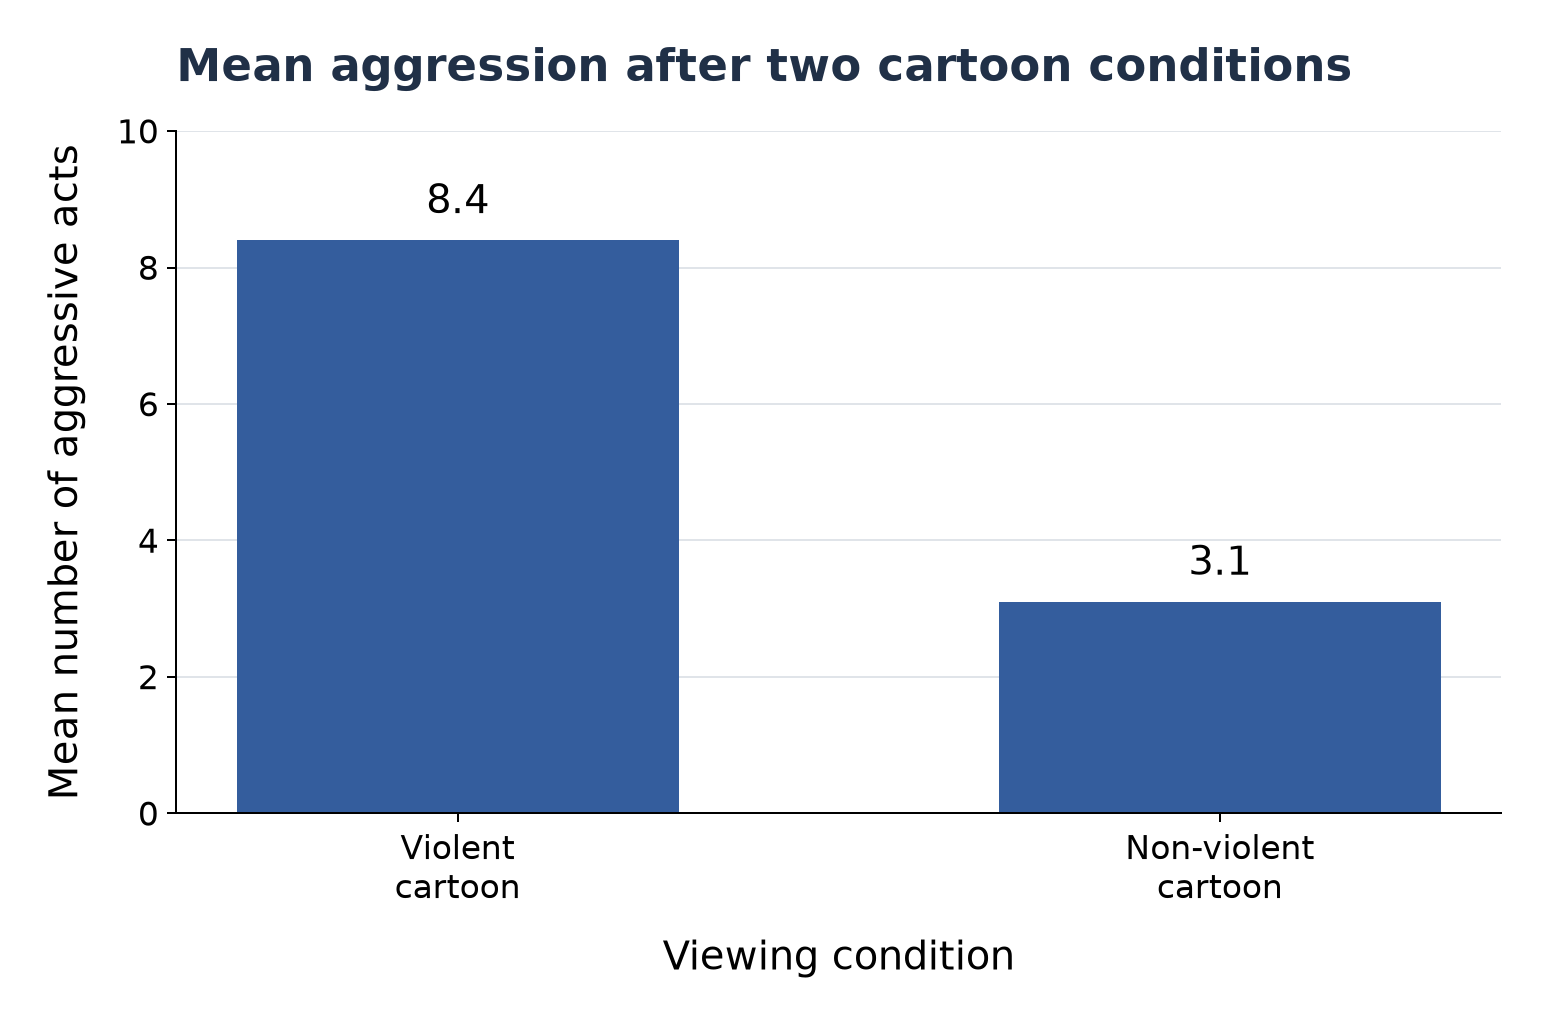
A psychologist compares the mean number of aggressive acts shown by children after watching either a violent cartoon or a non-violent cartoon. The violent cartoon group has a mean of 8.4 aggressive acts. The non-violent cartoon group has a mean of 3.1 aggressive acts.
A suitable display would be a bar chart. The x-axis would show the two viewing conditions: violent cartoon and non-violent cartoon. The y-axis would show "mean number of aggressive acts". The bars would be separated because the two conditions are separate categories. The taller bar for the violent cartoon condition would show a higher mean level of aggression.
To draw the chart, choose a y-axis from 0 to 10 with equal 2-unit steps, mark the two condition labels on the x-axis, then draw equal-width separated bars to 8.4 and 3.1. A point at 8.4 lies one fifth of the way from 8 to 10. Give the graph a title and label the y-axis "Mean number of aggressive acts". The source means are represented by bar heights, not by the number or width of bars.
[DIAGRAM: asset_name: Bar chart comparing cartoon conditions; asset_slug: 4_2_3_2_04_bar_chart; description: Separated bars from a zero baseline show mean aggressive acts of 8.4 after a violent cartoon and 3.1 after a non-violent cartoon.]
A histogram would be inappropriate here because the cartoon conditions are separate categories, not numerical intervals.
Continue this lesson.
You’re previewing NovaLearn without an account. Create a free account to read the rest.
Create free account