3.3.3 - Using and interpreting break-even charts
Use break-even charts to interpret profit, loss and the effects of changing prices or costs. Explain how the model supports planning and why its assumptions limit the conclusions a business can draw.
Reading business performance
A break-even chart helps a business compare expected revenue and total cost at different sales levels.
The intersection gives output where profit is zero. At a selected output, read revenue and total cost from their lines; their vertical difference gives profit or loss. Revenue above total cost means profit; revenue below total cost means loss. Use the output unit, currency and time period on the axes.
Illustrative monthly chart data: price is $8 per unit, variable cost is $3 per unit and fixed costs are $1,200. Break-even is units. The same lines give these readings:
| Output sold per month | Revenue ($ per month) | Total cost ($ per month) | Profit or loss |
|---|---|---|---|
| 120 units | 960 | 1,560 | $600 loss |
| 240 units | 1,920 | 1,920 | Neither |
| 360 units | 2,880 | 2,280 | $600 profit |
A sales forecast of 360 units exceeds break-even by 120 units. This difference is the margin of safety: sales could fall by 120 units before reaching break-even, assuming unchanged price and costs. A wider margin gives more protection against a sales shortfall, but a forecast is uncertain. Compare expected demand and capacity with break-even: a factory able to sell at most 200 units cannot reach a 240-unit target under these conditions.
Changes in revenue
A change in selling price changes the slope of the revenue line and can change break-even output.
At a higher price, each unit adds more revenue, so the revenue line becomes steeper. If costs stay unchanged, contribution per unit rises and fewer sales are needed to cover fixed costs. In the illustrative chart below, price rises from $8 to $9; variable cost remains $3 and fixed costs remain $1,200. Break-even falls from to units per month.
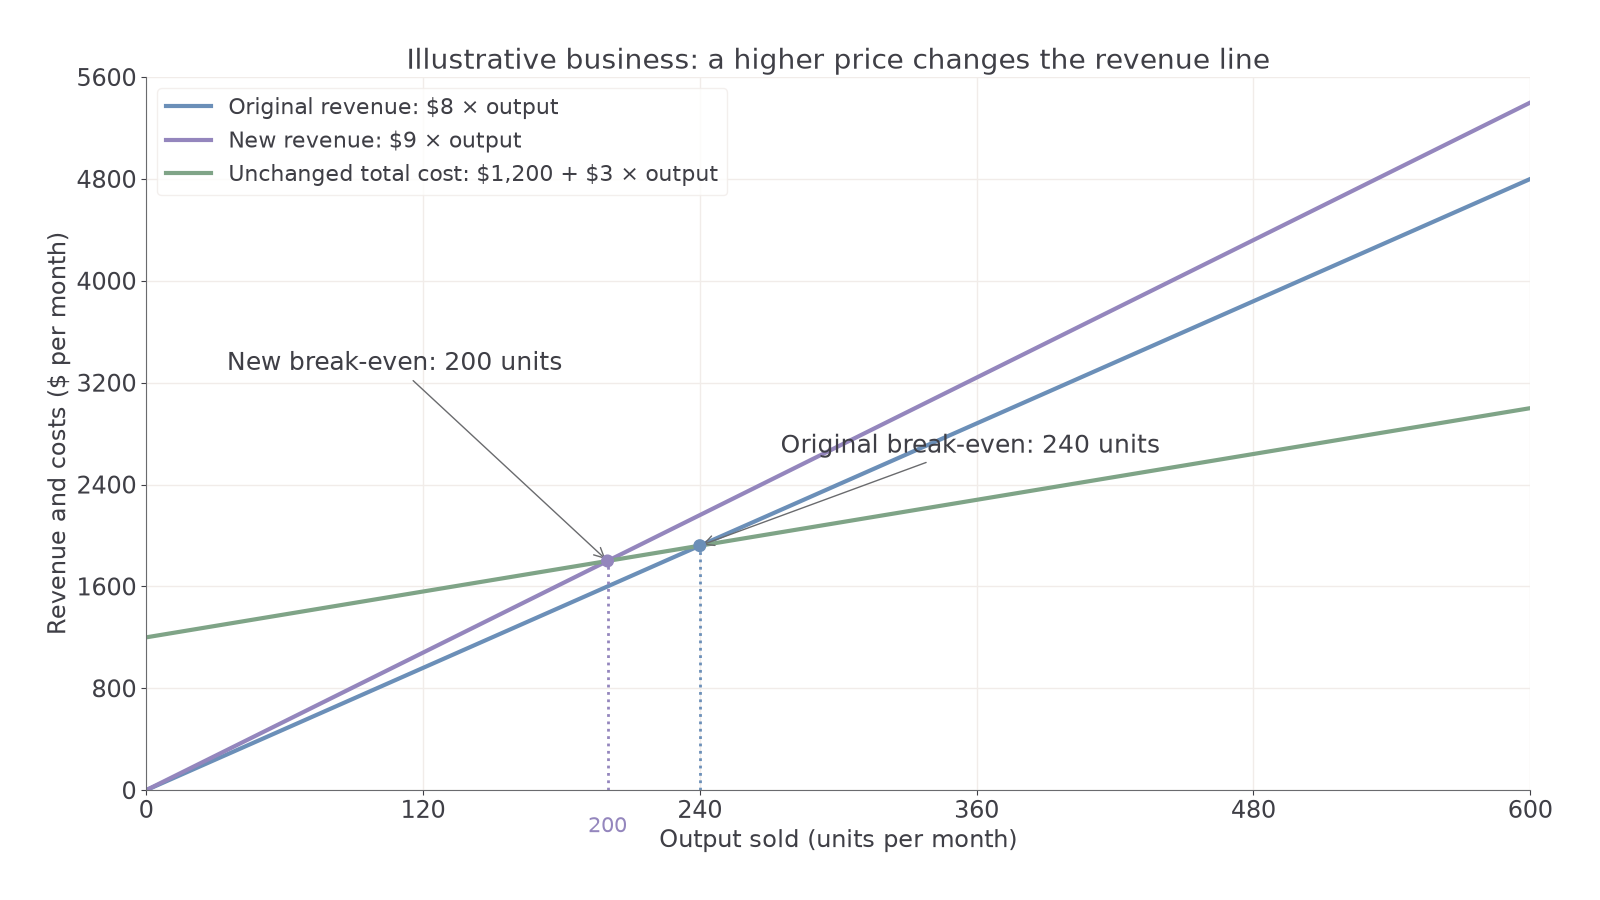
At 360 units sold, the original price gives $600 profit and the new price gives , or $960 profit. However, the chart does not show whether customers will accept the price rise. If sales fall to 180 units at $9, profit becomes : a $120 loss. The lower break-even target therefore does not guarantee higher actual profit.
A lower price makes the revenue line less steep and raises break-even output when costs are unchanged. A discount might still raise actual profit if the increase in quantity sold is sufficient. A change in sales volume alone moves the business to a different point on its existing lines; it does not change those lines or their break-even intersection.
Changes in costs
Fixed-cost and variable-cost changes affect different features of the total-cost line.
Continue this lesson.
You’re previewing NovaLearn without an account. Create a free account to read the rest.
Create free account