3.3.3 - Decision Trees
Decision trees help a business make choices when managers can estimate likely outcomes but cannot be certain which result will occur. For exams, you need three things: how a simple tree is constructed and interpreted, how the figures it generates are calculated, and why a business should still be cautious before trusting the final answer.
What a decision tree shows
A decision tree breaks a risky choice into clear routes so management can compare alternatives in a structured way. Instead of relying only on instinct, the business shows each option, the possible outcomes after each option, and the financial result attached to each outcome.
Decision trees
A decision making tool showing the possible outcomes of a decision with the estimated probability and expected monetary value of each of these outcomes.
To construct a simple decision tree, start with a decision point on the left and draw a branch for each option. From each option, add a chance node wherever the result is uncertain, then show the possible outcomes on separate branches. At the end of each outcome branch, include the payoff, such as a profit or loss, so the business can compare the likely consequences of each route.
Probabilities
The likelihood of possible outcomes happening.
Probabilities are placed on the branches leaving a chance node, and they should add up to 1 at that point. They may come from back data, market research, or managerial judgement. If those estimates are weak, the whole decision tree becomes less reliable because the final figures depend on those probabilities being sensible.
When constructing or interpreting a simple decision tree, these are the key checks:
| Element | What it shows | What to check |
|---|---|---|
| Decision point | The business choice | Are the main options included? |
| Chance node | Uncertain results after a choice | Are the realistic outcomes shown? |
| Probability | Likelihood of each outcome | Do the probabilities at the node add to 1? |
| Payoff | Profit or loss from each outcome | Is the financial effect clear? |
An airline such as easyJet could use a decision tree when deciding whether to launch a new route. Management can compare launching the route with not launching it, then estimate the probability of strong or weak demand and the likely profit or loss from each outcome before committing aircraft and marketing spend.
Calculating the figures
Once the structure of the tree is in place, the business can calculate the figure that lets it compare risky routes. This is done by weighting each possible payoff by its probability, so strong outcomes matter more when they are likely and less when they are unlikely.
Expected monetary rewards
The probability-weighted average monetary payoff from an option, not a guaranteed actual outcome.
In practice, students often call this the expected value or expected monetary value of a route. The important idea is the same: multiply each possible payoff by its probability, then add the results. A higher figure suggests a better average financial outcome if the estimates are accurate.
Expected value
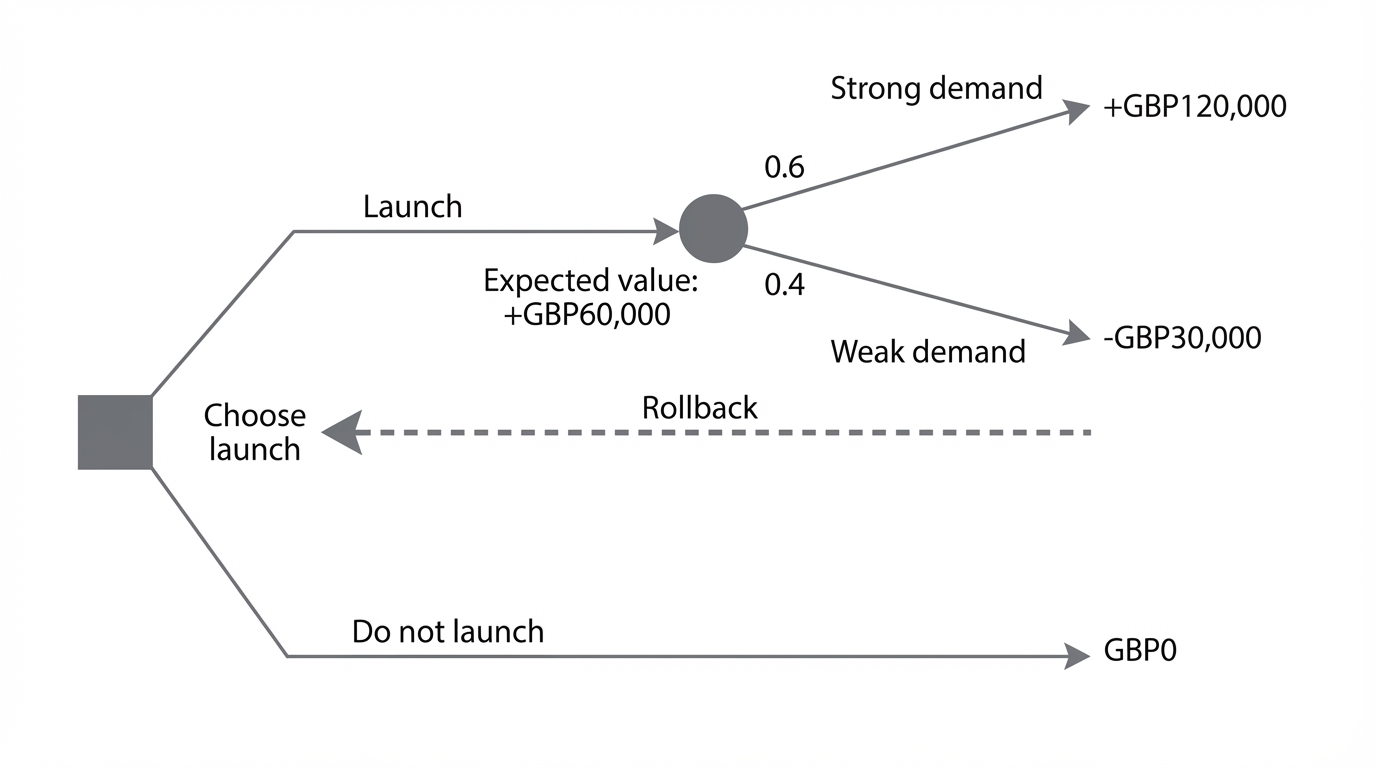
Suppose a snack manufacturer is deciding whether to launch a new product. If demand is strong, the payoff is +£120,000 with probability 0.6. If demand is weak, the payoff is -£30,000 with probability 0.4.
| Outcome | Probability | Payoff | Weighted payoff |
|---|---|---|---|
| Strong demand | 0.6 | £120,000 | £72,000 |
| Weak demand | 0.4 | -£30,000 | -£12,000 |
The expected value is £72,000 + (-£12,000) = £60,000. That figure helps management compare this option with another one. It does not mean the business will definitely make £60,000, because the actual result will still be one of the individual outcomes, not the average.
Interpreting and rolling back
Calculation alone is not enough. When you read a decision tree, start at the left-hand decision node, follow each branch through the chance node, and check the payoff at the end of each route before comparing the options. The rollback technique then means working from the right-hand side of the tree back towards the original decision point, calculating the expected value at each chance node before deciding which route to keep.
[DIAGRAM: asset_name: 3_3_3_decision_trees; asset_slug: 3_3_3_decision_trees; recommended_method: retained_png; description: Decision tree showing a launch decision for a new product. Start with a square decision node with two branches: Launch and Do not launch. The Launch branch leads to a circular chance node with two outcomes: Strong demand with probability 0.6 and payoff +£120,000, and Weak demand with probability 0.4 and payoff -£30,000. Show the expected value of the Launch branch as +£60,000. The Do not launch branch leads directly to a payoff of £0. Show rollback from right to left and indicate that Launch is chosen because it has the higher expected value.]
If a route has a direct cost not already included in its outcome payoffs, subtract it before options are compared. Do not subtract a cost again when the payoffs already include it. For example, one option might produce an expected value of £140,000 but need £50,000 of set-up spending, leaving a net expected value of £90,000. Another option might have an expected value of £95,000 and need only £10,000 of spending, leaving £85,000. The first option would be preferred on financial grounds because its net expected value is higher.
Continue this lesson.
You’re previewing NovaLearn without an account. Create a free account to read the rest.
Create free account