1.2.3 - Markets
This lesson explains how supply and demand interact to create a market price, and how to read a supply and demand diagram when a change in demand or supply causes price to rise or fall. In exams, this topic is often tested through short chains of reasoning, so the key is to explain both the cause of the change and the business consequence.
Market equilibrium
In a market, buyers create demand and sellers create supply. The market price settles where the quantity consumers want to buy matches the quantity producers want to sell. That meeting point matters because it gives a business a starting point for pricing, stock planning, and judging whether demand is strong or weak relative to supply.
Equilibrium price
The price where supply and demand are equal. Also known as the market-clearing price.
At equilibrium, there is no persistent pressure for price to change. That does not mean the price is low or fair; it simply means the market is in balance. If demand is very strong or supply is limited, the equilibrium price can still be high.
In Business, this framework is especially useful in markets where supply and demand are easy to see, such as agricultural products, commodity markets, hotel rooms for a given night, or tickets for events with fixed capacity. In these markets, the interaction of buyers and sellers has a clear effect on price.
Explain It Back
Use this as a self-explanation check after the section above. It is for diagnosing what you can already explain, not for learning new material from scratch.
Drawing and reading diagrams
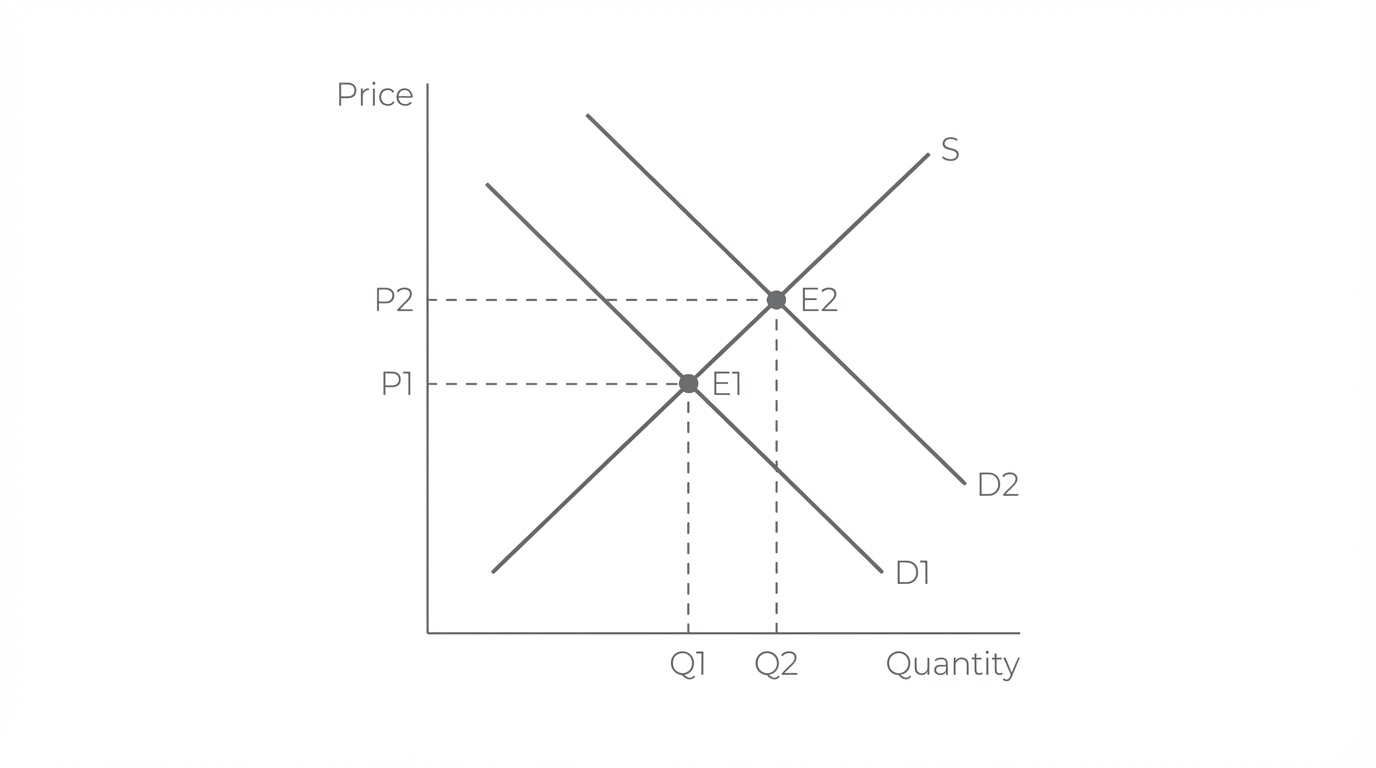
When reading a supply and demand diagram, start with the point where the curves cross. Put price on the vertical axis and quantity on the horizontal axis, then use the labels E1, P1, and Q1 to anchor the original equilibrium before you compare any later shift.
[DIAGRAM: asset_name: 1_2_3_markets; asset_slug: 1_2_3_markets; recommended_method: retained_png; description: Supply and demand diagram with Price on the vertical axis and Quantity on the horizontal axis. Original demand curve D1 and supply curve S intersect at equilibrium E1, with dashed projection lines to P1 and Q1. A second demand curve D2 is shifted to the right of D1 while supply stays fixed. New equilibrium E2 is shown with dashed projection lines to P2 and Q2. Make clear that P2 is higher than P1 and Q2 is higher than Q1.]
The first skill is spotting disequilibrium. If the market price is above equilibrium, suppliers are offering more than consumers want to buy. Read that as a surplus: unsold stock builds up, sellers become more willing to lower price, quantity demanded rises along the demand curve, and quantity supplied falls along the supply curve until the market moves back to equilibrium.
Surplus in markets
Where supply exceeds demand.
If the market price is below equilibrium, the opposite problem appears. Buyers want more than sellers are willing or able to provide, so competition between buyers pushes price upwards until the market returns to balance.
Shortage in markets
Where demand exceeds supply.
| Market price compared with equilibrium | What appears in the market? | Pressure on price |
|---|---|---|
| Above equilibrium | Surplus | Downwards |
| Below equilibrium | Shortage | Upwards |
| At equilibrium | Balance between demand and supply | Stable |
This is why interpretation matters. A strong answer does not just say "the market is above equilibrium". It explains the chain: a surplus or shortage appears, that creates pressure on price, and the market moves back towards equilibrium.
Shifts that change price
A price change by itself causes movement along the existing demand and supply curves. A change in a non-price factor shifts a curve and creates a new equilibrium point. In a diagram, keep the original curves visible so you can compare the old equilibrium with the new one, then label the new outcome as E2, P2, and Q2.
Non-price factors
Factors other than price, such as changes in consumer incomes, advertising, seasonality, or production costs, that alter market conditions.
If demand rises and supply stays the same, there is excess demand at the old price. Read the shift by tracing the new demand curve to its crossing point with supply: because more buyers are competing for the same output, price rises. That higher price encourages a movement to a new equilibrium where both price and quantity are higher. If demand falls, the reverse happens: price falls and quantity falls.
If supply falls and demand stays the same, less is available at the old price. That creates excess demand, so price rises, but quantity falls because the market now clears at a lower level of output. If supply rises, price falls and quantity rises.
In the UK potato market, bad weather reduced the harvest and made potatoes scarcer. That meant supply shifted left, so the market price of potatoes rose and businesses such as fish and chip shops faced higher input costs.
| Change in market conditions | Curve shift | New equilibrium | Likely business example |
|---|---|---|---|
| Demand rises | Demand shifts right | Price up, quantity up | Stronger weekday demand for hotel rooms |
| Demand falls | Demand shifts left | Price down, quantity down | Weaker Sunday demand for city-centre hotel rooms |
| Supply rises | Supply shifts right | Price down, quantity up | A stronger harvest increases food supply |
| Supply falls | Supply shifts left | Price up, quantity down | Higher costs or bad weather reduce supply |
The exam-ready habit is to say which curve shifted, why it shifted, and what happened to both equilibrium price and equilibrium quantity. That final step matters because the same price rise can come from very different causes.
Business consequences
Interpreting a supply and demand diagram means thinking like a manager. A business might be selling in that market, buying from that market, or doing both. So a rise in equilibrium price can create an opportunity for one business and a cost problem for another.
A Leeds city-centre hotel such as Hilton can sell the same executive room at very different prices across the week. In the textbook example, the room rate was much higher midweek than on Sunday because business-travel demand was stronger while the supply of rooms for each night was fixed.
For the hotel, stronger demand can raise room prices and revenue. For a business buying a key input, the effect can be negative: a higher market price raises costs and may squeeze profit margins unless the firm can pass the increase on to customers.
Timescale also matters. In the short term, supply may be quite fixed because capacity is limited. That means a rise in demand can create a sharp increase in price. In the longer term, firms may add capacity, hire more staff, or increase output, so supply becomes more responsive and the price rise may be smaller.
Sometimes both demand and supply change at the same time. If demand rises while supply falls, price is likely to rise sharply. If demand falls while supply rises, price is likely to fall sharply. In those cases, quantity depends on which shift is stronger, so judgement is needed rather than a mechanical answer.
Judgement Bank
When demand rises and supply cannot respond quickly, the equilibrium price can increase, which gives sellers a chance to earn more revenue. This is especially useful for businesses such as hotels or event organisers where capacity is limited in the short run.
A rise in market price is not automatically good news. If the price increase comes from a fall in supply, fewer units may be sold and firms that buy that product as an input can face higher costs and weaker profit margins.
The best judgement depends on the cause of the change and the timescale. In an exam answer, identify which curve moved, state the new equilibrium price and quantity, and then explain how that specific change affects the business in the short run and, if relevant, the longer run.